Ok, here in the dog and back to school days of August, I decided to milk one more column out of our annual work with the working capital data supplied again to SCDigest from REL, a Hackett Group company.
Last week's columns summarized inventory turns by over 60 industry sectors (created by SCDigest from REL's less granular grouping), as well as which companies had the highest and lowest turns in each of these sectors. (See Inventory Performance 2015 Part 2.)
Gilmore Says:
|
 It is fascinating to me to see the competitors with very similar turns - but more often than not there are rather significant differences in those values within each sector. It is fascinating to me to see the competitors with very similar turns - but more often than not there are rather significant differences in those values within each sector.  |
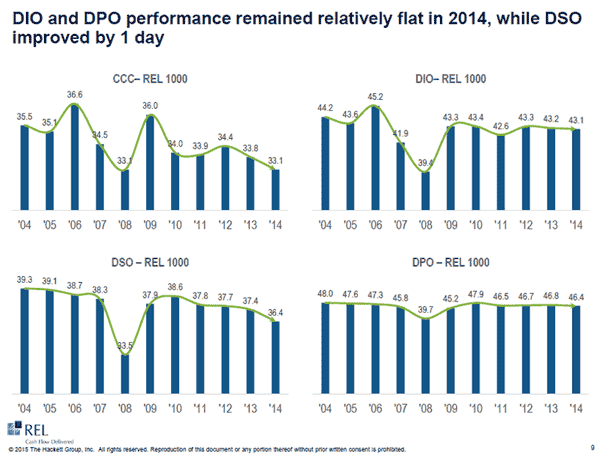
This week, a couple of more things. First, this interesting chart in REL's own report, summarizing working capital performance over the past decade overall and in its individual components, as shown below:

You can see overall cash conversion cycles are down about 7% from 2004 (an improvement). Inventory performance as measured by Days Inventory Outstanding (DIO) has improved about 2.5% over the same period, though is basically flat with 2010. And despite all the articles about big companies stretching out payments to suppliers over the past few years, Days Payables Outstanding (DPO) levels have contracted since 2004 and 2010, meaning payments are actually being made slightly faster on average.
With that relatively brief introduction, below you will now find a list of select grouping of companies in the same sectors and their inventory turn numbers in 2014. Think you will find it interesting:

It is fascinating to me to see the competitors with very similar turns - but more often than not there are rather significant differences in those values within each sector.
Why, for example, are turns at Pepsico so much higher the Coca-Cola's? I don't know for sure, but suspect it is because a significant share of Pepsico's business is from snack foods, which have to turn fast due to freshness issues.
But why does chemical maker HB Fuller have nearly three times the turns of DuPont? I have no idea, just that there are many variables in inventory levels, from service policies to supply chain models to trade-off management and much more, often including skills and processes.
And as we noted last week, toy maker Hasbro had slightly better turns than rival Mattel (6.0 versus 5.4), but if Mattel had equaled Hasbro's level, it would have generated an extra $58 milllion in cash flow in 2014.
Ok, I promise I am done now for 2015. But I'll be back for more next year, with a few expansions, based on some of the requests I have received in recent weeks.
No comments:
Post a Comment