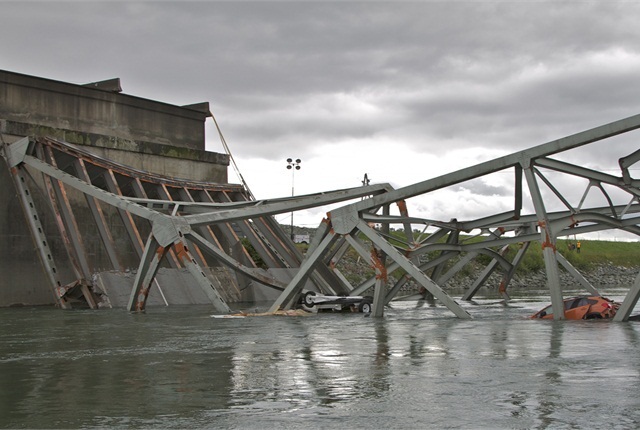
Nearly 59,000 Bridges Listed as Structurally Deficient
February 19, 2016
There are still 58,500 structurally deficient bridges in the U.S. according to a review of the 2015 National Bridge Inventory database conducted by the American Road & Transportation Builders Association.
The 2015 National Bridge Inventory recently released by the Department of Transportation shows that the number of bridges classified as structurally deficient did drop last year by around 2,500, but ARTBA estimates that at the current rate it will take at least 21 years before they are all replaced or upgraded.
While structurally deficient bridges make up around 9.5% of all of the country’s 610,000 bridges, ARTBA found that passenger and commercial vehicles cross these bridges nearly 204 million times a day.
A structurally deficient classification indicates that the bridge is in need of repair and that one or more of the key bridge elements, such as the deck, superstructure or substructure, is considered to be in poor or worse condition, according to ARTBA. State transportation departments inspect bridges regularly for deterioration as a matter of public safety and use the scale of 0-9 to indicate the current state of the bridge. Structurally deficient bridges score a 4 or lower.
The rating does not mean that the bridges are unsafe, but it is used to educate the public and government officials on the state of their roads.
“Every year we have new bridges move on the list as structures deteriorate, or move off the list as improvements are made,” said Alison Premo Black, ARTBA’s chief economist. “It’s going to take major new investments by all levels of government to move toward eliminating the huge backlog of bridge work in the United States.”
Iowa, Pennsylvania, Oklahoma, Missouri, Nebraska, and Kansas make up the top five states with the most structurally deficient bridges.
For a state by state breakdown and analysis, visit the ARTBA bridge report website.

No comments:
Post a Comment