| Comparing Cash Flow at Amazon and Walmart |
Many know Amazon doesn't make much if any profit despite its enormous sales growth, with continued massive investments and losing billions on shipping taking their toll on the bottom line.
But others will say "Look at the cash flow, it tells a better tale" - and to a certain extent it does. The graphic below compares operating cash flow as a percent of revenue between Amazon and Walmart over the past five year: 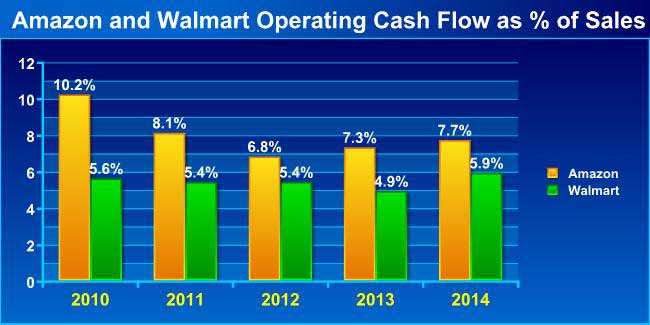 Amazon's operating cash flow is higher as a percent of revenue than Walmart's of late, as can been seen. However, note the consistency of the Walmart numbers. But there is operating cash flow and what is called "free cash flow." The latter equals operating cash flow minus capital expenditures, and here is where Amazon's spending habits kick in. While Amazon had operating cash flow of $6.8 billion in 2014, it had Capex of….. $4.89 billion, or a whopping 72% of operating cash flow.
Walmart, on the other hand, had Capex of about $12 billion against $28.5 billion in operating cash flow, or just 42%. (You could look at this other ways, such as deducting gains on assets sold during the year from the Capex spend to get a net total, but my numbers tell the story as is). Walmart also has to pay a dividend - $6.1 billion worth last year - while Amazon does not, meaning Amazon can get away with spending more on fulfillment centers without that burden.
|
Friday, March 20, 2015
Subscribe to:
Post Comments (Atom)
No comments:
Post a Comment