Clash Of The Online Titans: Amazon Versus Alibaba


Introduction
Today, we take a look at the two online retail titans, consider how each business model differs and delve into the trends shaped by the financial results.
The biggest difference between the two is that Amazon (NASDAQ:AMZN) primarily sells directly to consumers, building a network of warehouse and distribution centers with a goal of ever-improving fulfillment. Alibaba (NYSE:BABA), on the other hand, is less capital intensive and provides only a platform from which other businesses can sell directly to consumers. While both offer a platform for other sellers, AMZN is more focused on the logistics and engaging directly with consumers. That is not to say that Alibaba does not engage with consumers, but that it is not a part of the full retail purchase cycle.
Another way to look at the two is that AMZN is more likely to create jobs internally within the company while destroying jobs at brick-and-mortar retailers. Meanwhile, BABA may have created a medium with which retailers can compete more efficiently and enter new markets, therefore creating competition among retailers, but it also is more likely to help create jobs externally within the small and medium sized retailers that its platform enables. AMZN does some of that, too, but it then competes directly with its partners; BABA refrains from competing with its partners.
Obviously, both companies are much more than just retailers. AMZN is a leader in cloud services to businesses, large and small. This is, once again, another capital intensive model, but at least it produces higher margins and free cash flow. It manufactures and sells electronic devices, once again, another relatively capital intensive business that requires much investment. AMZN also offers online streaming of movies and TV episodes. It is into online publishing, co-branded credit cards and other peripheral supporting services, but the main three are: e-retail, web services, and electronics manufacturing.
BABA is also focused on e-retail but in a somewhat different fashion as noted above. It has multiple platforms to provide services to different types of sellers and end users. Its original Alibaba.com is actually a wholesale marketplace. It offers marketing support and services to its retail clients, online travel booking services and its own version of cloud computing services. It also has an array of other closely (and less so) connected businesses in areas such as finance. Most of its products and services are technology based and offered primarily to businesses. Even its retail platforms enable the businesses that sell rather than getting into direct sales and distribution.
Both tend to enter a business area with the intent of dominating geographically within their respective spheres of greatest influence. Both seem intent to expand globally. So, there are relative similarities as well as differences. Of course, we do not expect either one to put the other out of business since the models really are quite different. AMZN may make it harder for BABA to expand into the U.S. and vice versa in China due to built up consumer loyalties, but there will be challenges and battles between the two on a global scale, especially outside China and the U.S. Now, we will attempt to sort through some of the metrics used to measure results to determine which business model has a better chance of winning on the global scale.
A look at Amazon through charts
The charts below were created by Mark Bern, CFA, using source data from oldschoolvalue.com.
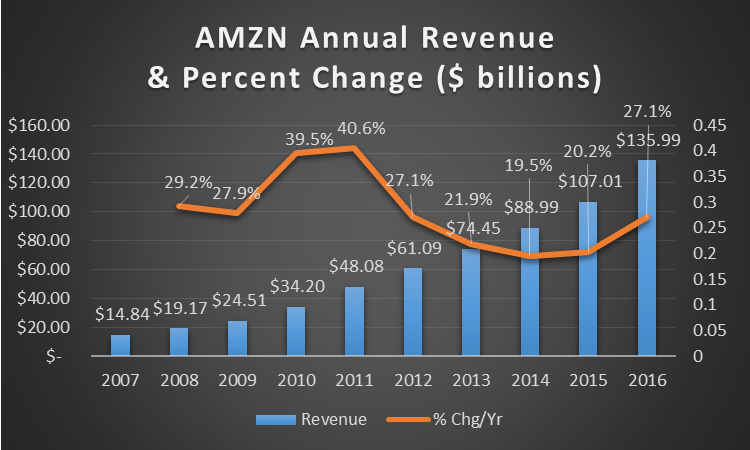
Revenue continues to rise, and with the growth of the AWS (Amazon Web Services) unit, even the rate of change is rising again. This is not news, but it does astound Wall Street analysts and investors alike that a company the size of AMZN can continue to grow at such high levels.
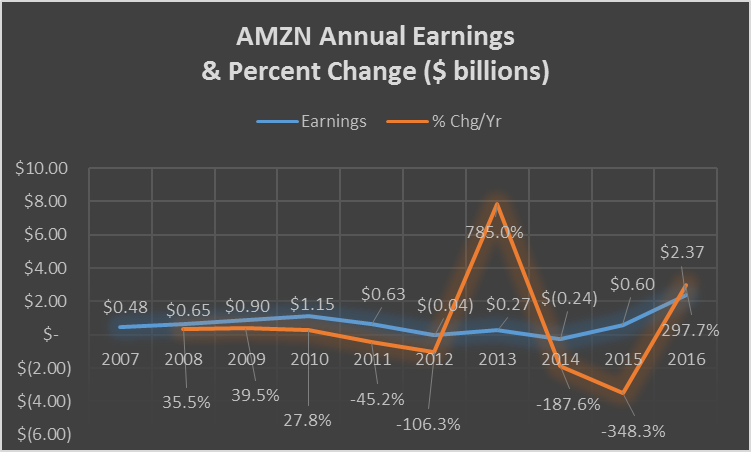
Earnings, on the other hand, have been sporadic. Do not get too excited about the 785 percent spike from 2012 to 2013; the increase is less than meets the eye. To put the jump from a loss of about $40 million to a profit of $270 million, we should look at it in terms of profit margin relative to revenue. A reasonable margin for a solid, well managed company should be in the range of ten percent or higher. AMZN "jumped" all the way up to a net profit margin of less than four tenths of one percent. When looking at it through the lens of reality with the rose coloring removed, it looks less spectacular. But the 298 percent rise in the last fiscal year is much more outstanding. Now the net margin has moved up to 1.7 percent. Nothing to write home about yet but moving in the right direction.
Free cash flow (depending on how one calculates it) is get more interesting, too. We like to see a free cash flow to revenue ratio above 15 percent. AMZN is now at 7.1 percent but rising.
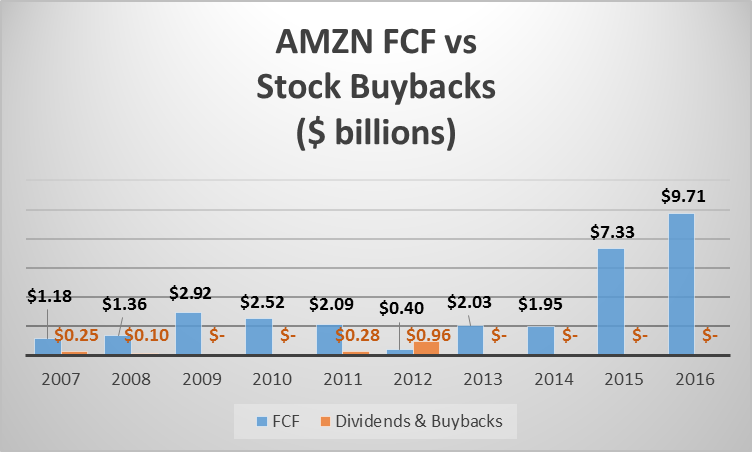
Stock repurchases have been nonexistent in recent years and were never a big thing at AMZN. Of course, with the price sky high as it is, why would management buy back its own stock? But it has not issued any stock for cash either. The stock, at a high valuation, is valuable in two ways to management: first, as a currency if it desires to use stock in acquisitions; and second, as a non-cash source of compensation for executives.
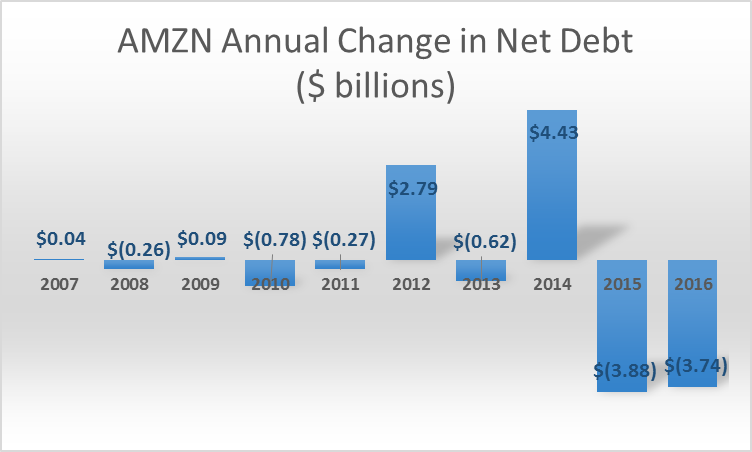
Looking at the change in net debt by year in the chart below, AMZN took advantage of low interest rates when in need of cash beyond its cash generated from operations to invest heavily in its capital structure. In the last two years, it has produced enough free cash flow that management has been able to reduce debt; a commendable path if sustainable.
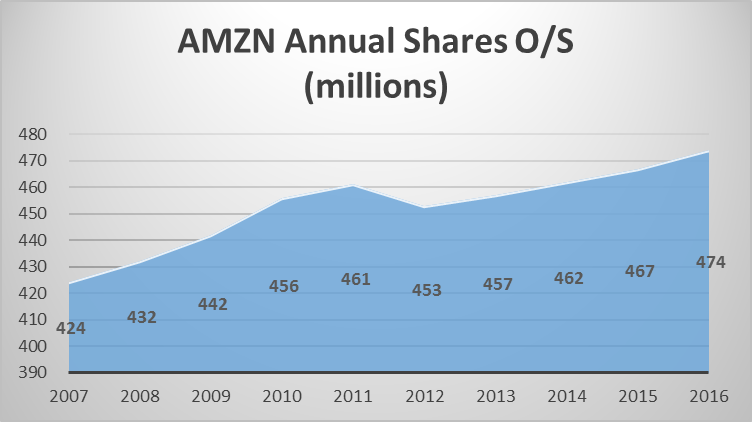
The following chart is where things get interesting. The company has been issuing shares of late, but there is no cash flowing in from such activities reported in the cash flow statements. It would appear that compensation through options are getting interesting since the seven million shares issued in 2016 would now be worth $6.58 billion. Nice work if you can get it. I must assume that the vast majority goes to one person ("He who shall not be named" in many brick-and-mortar retailer circles).
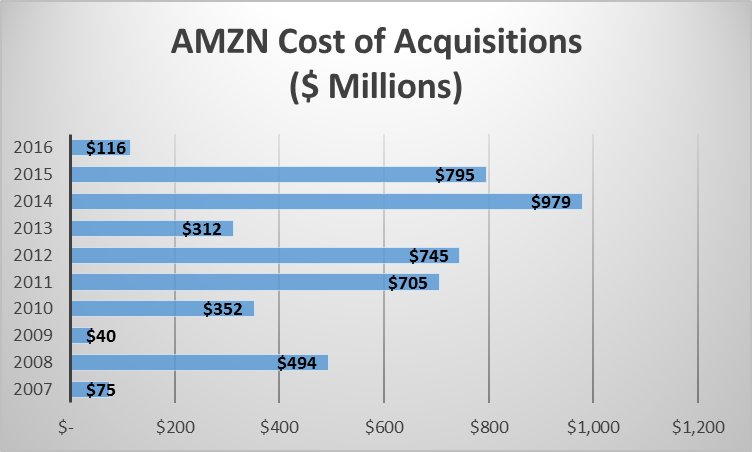
AMZN has been acquiring smaller companies for a number of reasons. It acquires companies with patent protected technologies that can help it operate more efficiently as well as companies that can help it expand its product line, improve customer service, enter a new line of business or some that could someday pose a threat. Apparently, there just was not much of interest in 2016 or the price to acquire had gotten too great. I actually like that the company does not make acquisitions or buys back shares at lofty prices. That seems so common-sensical but rarely do I come across such street smarts in corporate America.
A look at Alibaba through charts
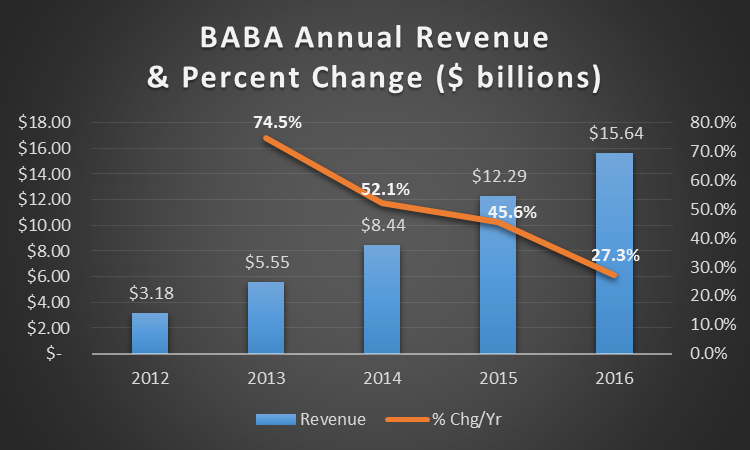
Looking at the revenue chart for Alibaba (the shorter time period is due to fewer years as a publicly listed company on US exchanges), we also see a very nice upward trend. But the annual rate of growth is slowing. Of course, it started at a higher growth rate than AMZN did and the rate has not yet fallen as low as that of AMZN, so the trend is not too concerning at this point. If it were to keep falling to much below 20 percent a year and not rebound, then it might show a weakness on relative terms. So far, it is still impressive.
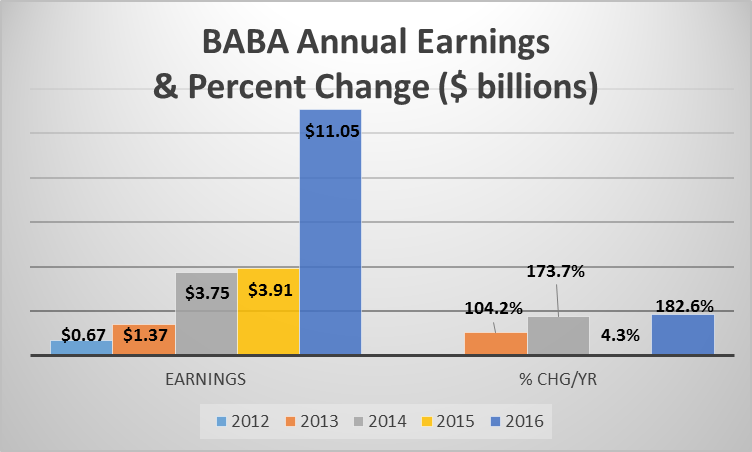
Earnings tell a different story for BABA than what we saw from AMZN. It represents the differences in the business models. Here the rise is consistent, even though 2015 was basically flat, and the trend is impressive with the rate of earnings growth exceeding 100 percent in every year other than that. Increasing earnings at 182.6 percent in one year of sales of $15 billion is pretty impressive. But it is even more important, once again, to look at the net profit margin being generated. BABA has a net profit margin of 71 percent, up from a mere 32 percent in the prior period. That is the sort of story for which we are looking to help us fall asleep at night. We need to keep an eye on future quarters to see if that level of margin is sustainable.
The picture on shares issued and bought back by BABA is more confusing. The chart below, taken alone, is straight-forward enough. But it shows issuance of $9.98 billion in shares in 2015, yet when we scroll down to the shares outstanding at year-end, the number of shares hardly registered a change.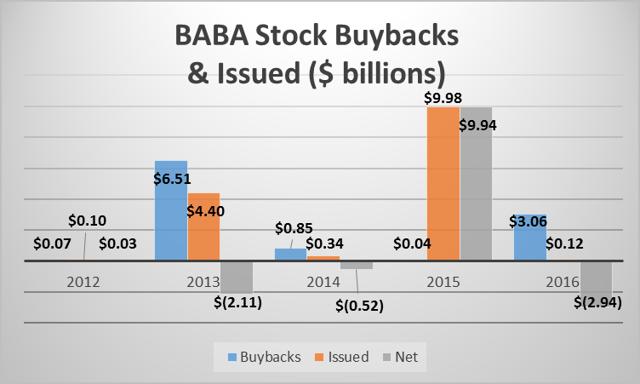

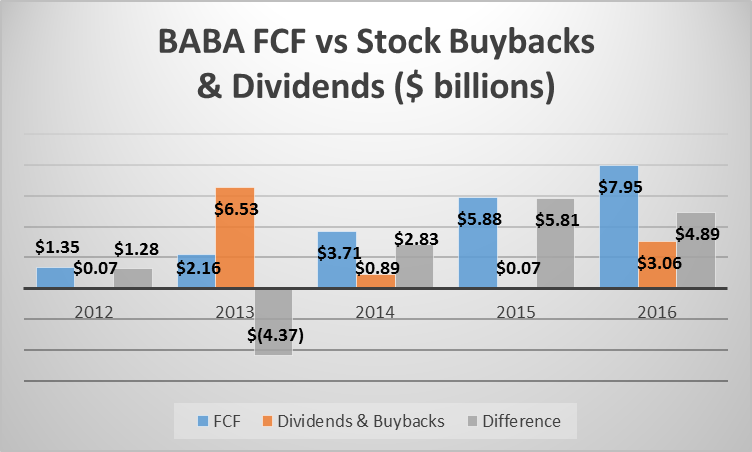
With the single exception of 2013, FCF (free cash flow) for BABA has exceeded the combined outlays for stock buybacks and dividends. Dividends were barely a blip (about $80 million paid out over four years) in the early days and have disappeared altogether in the last fiscal year. The positive take away is that FCF has grown in each of the years since the company began filing in the U.S. Once again, as a percentage of revenue, FCF generated by BABA is significantly higher than that for AMZN.
I suppose it is to be suspected that a company will add debt when interest rates are low and beginning to rise. This appears to be the case for BABA, but I am not alarmed since the company also has long-term investments on its books valued at over $18 billion, short-term investments of another $1.4 billion and cash of more than $16.5 billion. The company has plenty of flexibility in its capital structure.

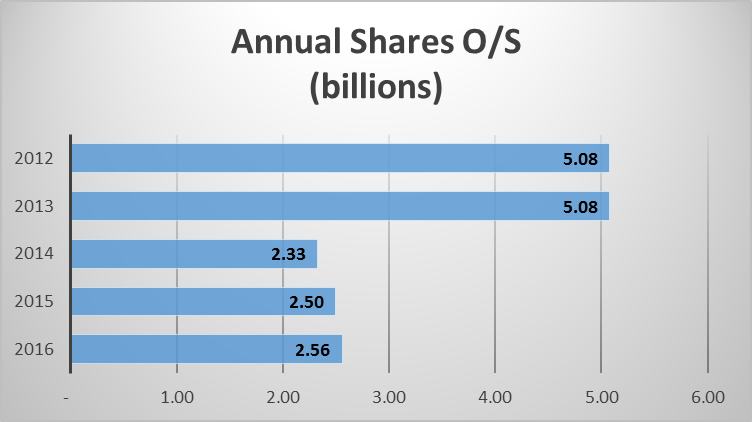
This next chart adds to the confusion I mentioned earlier regarding shares issued. The two results do not make sense. But since the company did not begin filing with the SEC until 2014, the dramatic drop in shares outstanding will remain a mystery until I find a good source of reliable data that can explain the incongruity.
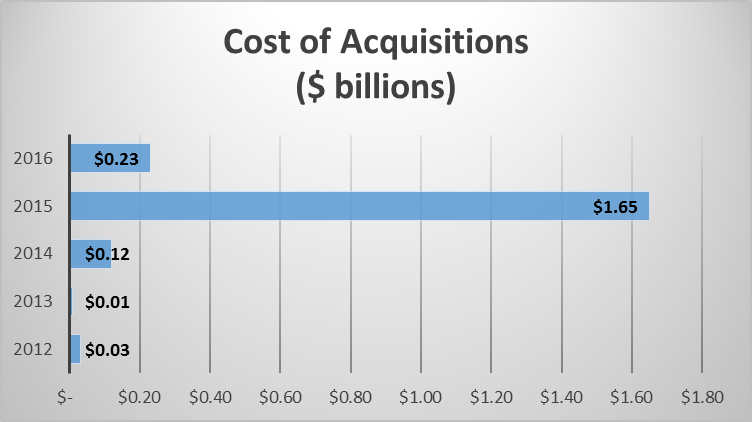
BABA has made fewer acquisitions than AMZN in its early days but did make some sizable investments in 2015. The company is making a push into financial activities where it can both enable more sales of client products as well as facilitate expansions by those same online retailers and other customers. It may rile some of the banks in China at some point, but thus far, it has been able to plow ahead without attracting restrictive sanctions by its government. That is the result of its founder's cultivation of relationships with the right people.
A side by side comparison
| Amazon | Alibaba | Better if | |
| Compound annual revenue growth rate | 27.9 Percent | 48.9 Percent | Higher |
| Compound annual earnings growth rate | 19.5 Percent | 101.4 Percent | Higher |
| Debt to Equity ratio | 35 Percent | 27 Percent | Lower |
| Current P/E (trailing twelve months) | 184.7 | 55.2 | Lower |
| Price to Sales ratio | 3.37 | 22.38 | Lower |
| Price to Book ratio | 22.17 | 10.43 | Lower |
| Price to Free Cash Flow | 50.09 | 44.04 | Lower |
| Compound annual FCF growth rate | 26.4 Percent | 55.8 Percent | Higher |
| R&D to Revenue | 0 | 13.63 Percent | Higher |
| Cash to Revenue | 15.1 Percent | 115.7 Percent | Higher |
Alibaba is a much newer and smaller company so the higher growth rate on revenue comes as no surprise. These are compound annual rates of change over ten years for Amazon and five years for Alibaba. If I had kept the time frame the same (five years) on both, the rate of revenue growth for AMZN slows down, but the earnings growth rate jumps because the company lost money in the base year. That did not make sense so I kept it to the growth rates over the time frames over which I generally compare companies (ten years) for AMZN and used what was available for BABA.
Debt to equity is not a problem for either of these power houses as both have enough cash on hand to completely pay all long-term debt should it be desired.
The current P/E ratio is one of those things that speaks to the difference in value. AMZN, with a P/E ratio of 184.7 and a compound earnings growth rate of just 19.5 percent, looks pricey to me. I know that the earnings growth rate for 2016 over 2015 is astronomical, but the rate in the year before was negative and by an even larger degree. I prefer consistency and a positive trend. A P/E of 55.2 for BABA may seem high unless one considers its compound earnings growth rate of 101.4 percent; then it seems almost paltry. The question investors need to ask themselves is whether or not this level of growth is sustainable. Even then, if the rate falls by half, the P/E would still be reasonable.
AMZN is the king of revenue generation in this bout, being a much larger, more mature company. It therefore makes total sense that the Price to Sales ratio would favor it. But then BABA looks so much better on a Price to Book Value ratio basis. Still, the P/BV ratios would be high for both companies if one did not take into account the future growth potential that is being priced into the market valuations.
Price to FCF is one of my favorite ratios so I like the lower number sported by BABA. Still, it is much higher than I generally consider a good value. The problem with this ratio in this case is that this is not a "normal" growth story company. Normally, a great growth story for a company of this size is often considered more in the range of 20 percent per year. So, I need to adjust my thinking to make 100 percent compound growth in earnings. It is also worth noting the difference in the compound annual growth rate in FCF for the two firms. A rate of 26.4 percent is excellent for a company the size of AMZN, but 55.8 percent compounded growth for BABA is unbelievable! Factoring that into the equation, suddenly the higher P/FCF ratio looks more reasonable, at least for BABA.
It would appear that AMZN buys its technological advances rather than developing it in-house, at least that is how the company reports its R&D (research and development) expenses. It is not the wrong approach since those purchases can be depreciated to reduce tax liabilities. But I like a company that devotes a healthy portion of revenue toward R&D, as does BABA.
Part of me likes to see a cash cushion and part of me thinks this might be poor cash management, but in a year of near zero interest rates, I lean toward having the cash. Both companies have sizable cash hordes: AMZN has $15.5 billion and BABA has $16.5 billion. It seems equal until one considers the difference in the size of the two companies and then, suddenly, the cash position of BABA looks absolutely huge in comparison.
What does the Friedrich Algorithm tell us about these two stocks?
My first impression is that there is way too much red in this AMZN datafile and so much more green in the BABA datafile. But I want to be fair so I will take a closer look at some of my favorite ratios and will ignore the estimated price for each, at least for now.
FROIC is one of my favorite ratios. It measures the free cash flow return on invested capital, or how much additional FCF will be generated by each new dollar the company invests. It is a good measure of how efficiently management allocates capital. AMZN has a spotty record in this area, with some very good years (above 20 percent) and also some bad years (low single-digit or negative). I like to see consistency and I do not see that from AMZN in this ratio over the years.
AMZN runs a capital intensive business, something that requires a lot of capital investment to keep the company growing. It also requires a lot of cash just to maintain its assets in good working condition. This is evidenced by the CapFlow ratio. The negative side of this issue is that the business model requires gobs of cash year after year. With extremely low margins, the company could someday have difficulty in generating enough cash to realize its future growth prospects. So far, the competition has not stiffened to the test. Companies like Wal-Mart (NYSE:WMT) are beginning to figure out the online retail business, though, so the future may hold more difficult times for AMZN than has the past. The jury is still out in this area as the battle has only just begun and has a long way to play out. But those low margins could come back to haunt AMZN if those pesky folks over at Wally World come to understand how this game is played. This seems like a potential risk to me.
The Friedrich Cash Machine determines how much FCF is generated by each dollar of revenue. This is where we see how slim the margins are, not just in earnings but in FCF generation too. I generally like to see this ratio in the mid-teens, or at least the high single digits if all else looks good. AMZN is very low and had a run of negative results for several years. That is simply not a good sign.
The obvious winner for AMZN is the revenue growth line which I covered above so I will not dwell on it here. If readers would like to understand more about each of the ratios (because I do not want to bore people with too much in an article), the explanations and calculations can be found in this link. Once the page loads, just scroll down to find the explanations and formulas.
Skipping down the table, there are no concerns registered in either the Bankruptcy Center or the Fraud Center. Finally, I like to look at the Price to Bernhard/Buffett ratio (Price to FCF). This tells me if the stock price is selling at a bargain relative to its future free cash flows and should be below 15 to register as a bargain. At 126, AMZN is way overvalued based upon a FCF analysis. But what did we expect?
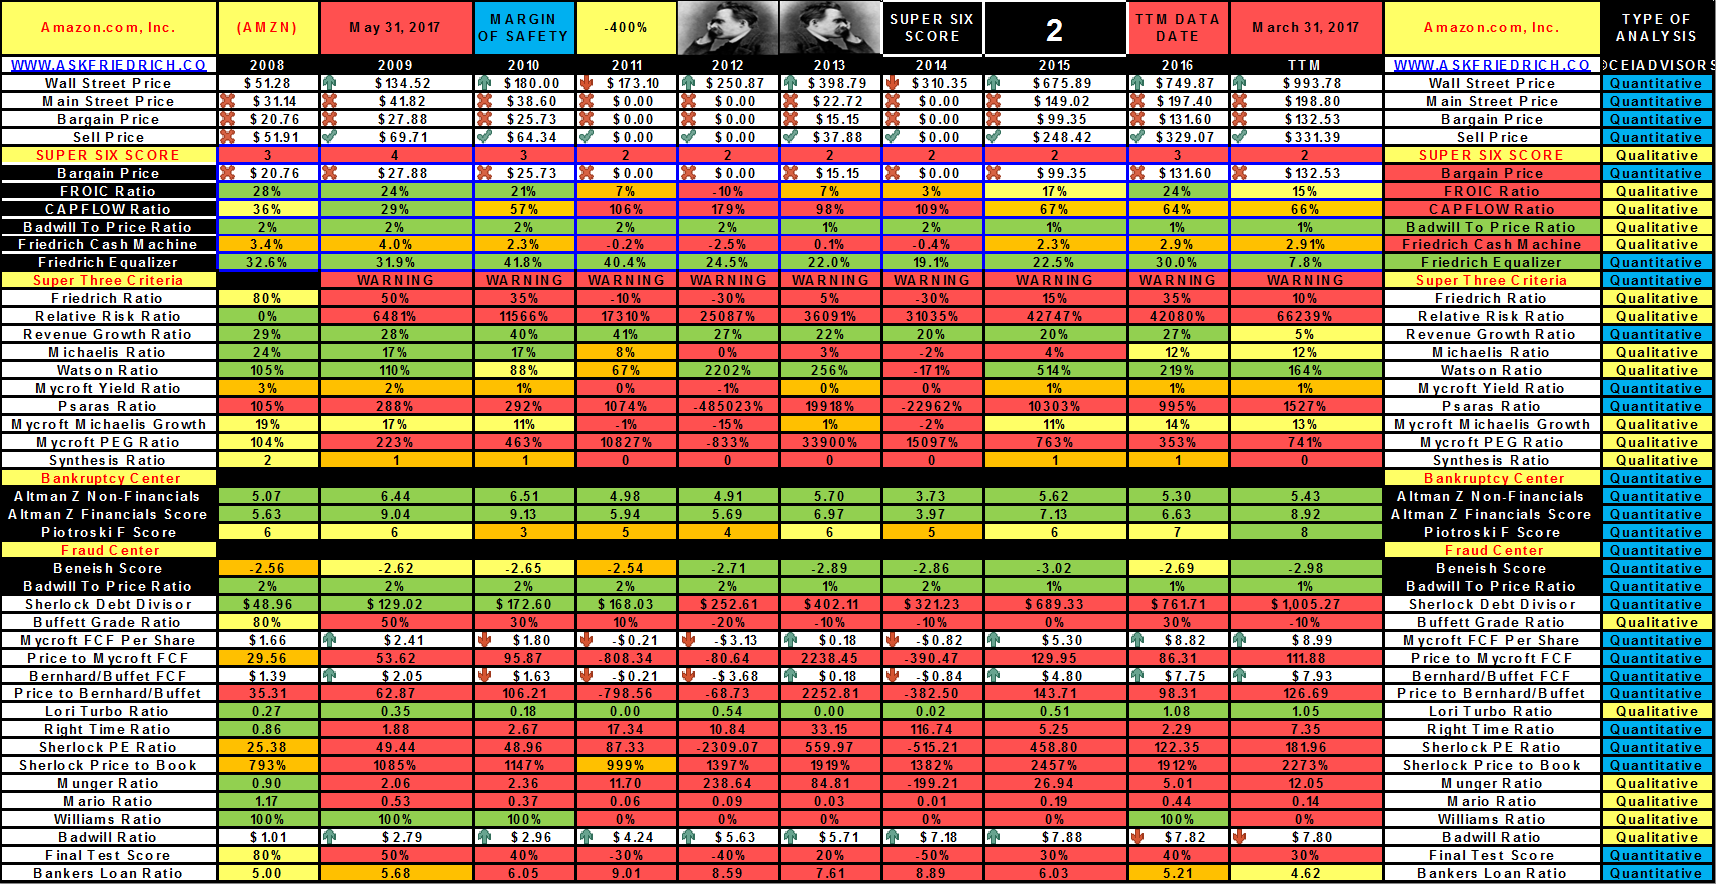
Source: AskFriedrich.com
Now, looking at the BABA datafile, I get much better vibes running through my body because I really like the color green, especially when it shows up in abundance on a Friedrich datafile. The lowest FROIC ratio for BABA was 19 percent and the most recent was 27 percent, so I am happy with this result as it is above my preferred level.
The CapFlow ratio is single digits so I am pleased with that result as well. I skipped over the Badwill measure because both companies had a problem there.
The Friedrich Cash Machine ratio is absolutely incredible! What I really like about this ratio is that it has improved over time, a sign of a well managed company that keeps costs low relative to revenue. Speaking of revenue, the growth rate is great as mentioned above so I shall dwell no further on it here.
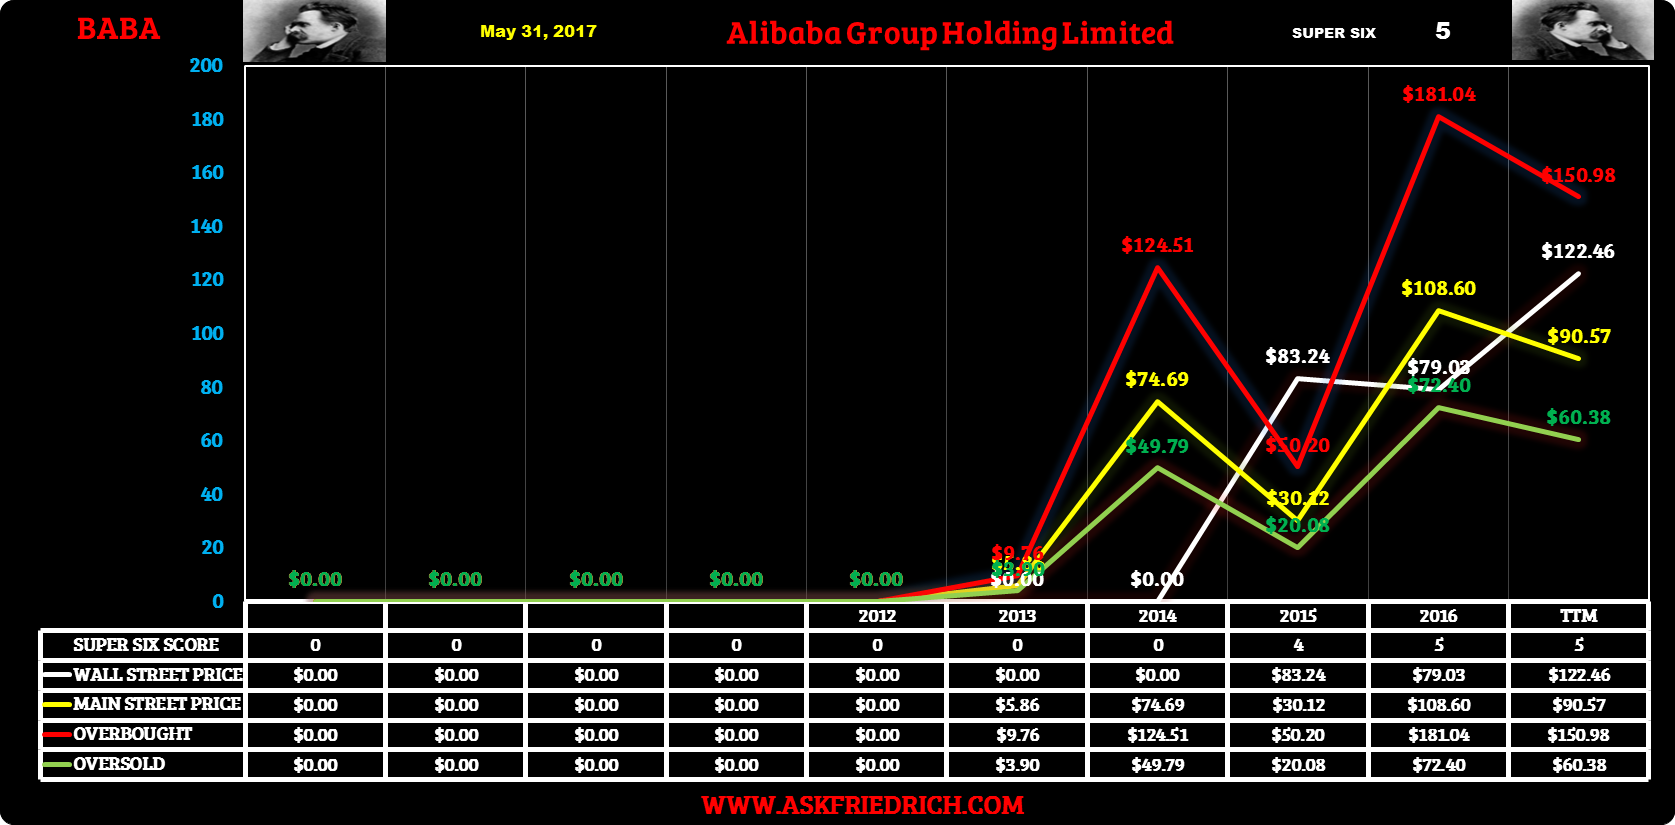
There are no current problems showing up in either the Bankruptcy or Fraud Centers so I will move on to the Price to Bernhard/Buffett ratio. It is a little high as of the date of this update (May 31st). But it can change with each new quarterly result posted and with fluctuations in the price. Notice that in 2016, it actually gave us a good entry price which you can see if you scroll down to the Friedrich Chart for BABA just below the datafile. That is when we added the stock to our model portfolio at $91.80. The price has since jumped which makes this ratio rise also.
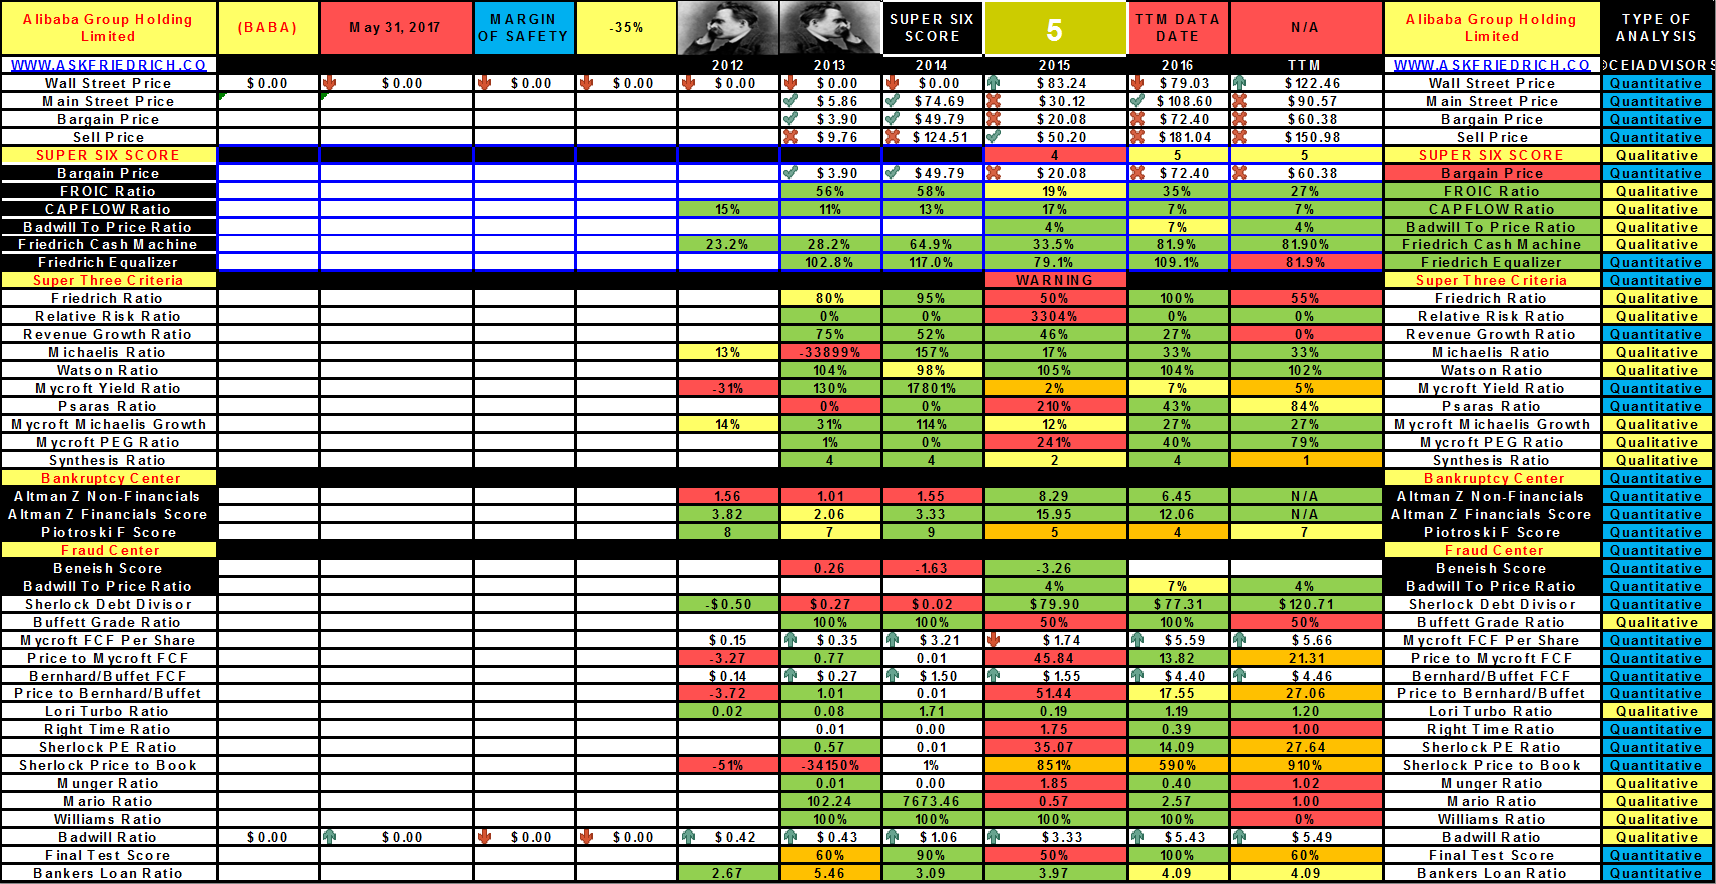
Source: AskFriedrich.com
Source: AskFriedrich.com
Conclusion
Both stocks are currently overvalued. But in case you have not guessed yet, I like the potential of Alibaba much more than that of Amazon. BABA produces much better profit margins and free cash flow because it is very light on capital outlays to support growth of the business. I believe that BABA has some significant advantages over AMZN in the race to expand globally. It requires less capital investment to expand its footprint and enables businesses to expand reach in each country it enters rather than putting locals out of business.
I see AMZN having to wage battles with the likes of BABA in its quest to expand globally, while also having to contend with deep-pocketed competition like Wal-Mart in the Americas for additional growth in its main market. BABA seems to be doing what eBay (NASDAQ:EBAY) founders envisioned, only better, and its reach extends into many other areas well. I give the nod to BABA hands down but would wait for another buying opportunity similar to the one we had last year.
No comments:
Post a Comment