This Off-Price Retailer Is The Antithesis Of Amazon

Summary
The TJX Companies, Inc. is the leading off-price specialty retailer of apparel and home fashions in the U.S. and worldwide.
This well-managed company is ranked second for margin of safety on the Main Street 20 Watchlist.
But the retailer generated just 1% of revenues from online sales in fiscal 2017.
Shouldn’t we buy Amazon instead and be done with it?
Welcome to the 19th installment of the "Main Street Value Investor (MSVI)" series, the off-price retail edition, exclusively on Seeking Alpha (subscribers to the MSVI Member Forum got the first look at this research).
The TJX Companies (TJX), the global storefront powerhouse we know as T.J. Maxx, Marshalls, and HomeGoods in the U.S., derives just 1% of its net sales from online purchases. In the evolving world of retail, defined by the hyperbolic growth of online sales at Amazon.com (AMZN), we believe TJX has earned its stellar reputation with price-conscious shoppers that prefer to browse at a neighborhood storefront that he or she has come to know and trust.
However, to ultimately satisfy device-dependent customers, TJX needs to grow its online presence. Nonetheless, as value investors, we prefer the microeconomic metrics and multiples of TJX over the macroeconomic popularity of AMZN despite its astronomical valuation worthy of a Blue Origin spaceship.
Gentlemen Prefer Bonds; We Prefer the Yields of Stocks
 Marilyn Monroe in Gentlemen Prefer Blondes (20th Century Fox, 1953)
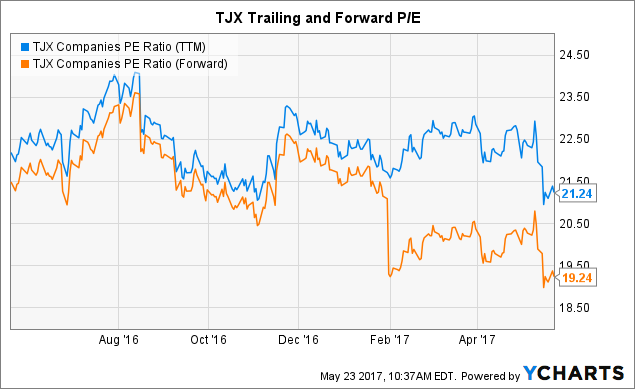
TJX is a large-cap stock in the specialty retail industry within the consumer discretionary sector. As of this writing, its market capitalization was an approximate $48 billion. TJX’s price-to-earnings ratio (P/E), or current stock price relative to earnings per share for the trailing 12 months, is approximately 21 times versus about 20x for the specialty retail industry as a whole. In comparison, the consumer discretionary sector is trading at ~24x P/E against ~22x for the Standard & Poor's 500 Index.
Our perpetual skepticism in forecasting aside, the forward price-to-earnings ratio for TJX is approximately 19 times compared to about 21x for the consumer discretionary sector and ~18x for the S&P 500. The current and trailing P/E ratios for TJX appear in-line relative to the specialty retail industry, the consumer discretionary sector, and the market as a whole.
As of May 16, 2007, The TJX Companies' earnings per share (EPS) was $3.52 annualized, netting a 4.74% earnings yield, i.e. EPS divided by the most recent stock closing price. We view earnings yield as the equivalent of a stock’s equity bond rate or how a company’s earnings compare to the 10-year treasury rate. As of the market close on May 19, 2017, the 10-year Treasury was yielding 2.12% or less than half of TJX’s earnings yield.
As of this writing, TJX is paying a moderate 36% of its EPS to shareholders in an annual dividend of $1.25 per share paid quarterly, resulting in a 1.68% dividend yield. Although relatively modest in the case of TJX, we enjoy the compensation of dividends in the short-term, as we patiently wait for the compounding of the stock price over the long-term.
According to TJX investor relations – a relatively easy to read and follow IR site - the company has increased its dividend rate for 21 consecutive years. TJX is planning between $1.3 and $1.8 billion of share repurchases in 2017. Through its share buyback program, TJX had repurchased over $18 billion of stock since 1997.
When executed with consistency and forethought, dividend increases and share buybacks return long-term value to the patient owners of a company’s stock.
Modest Advertising Spend; Less Reliance on Fads
An understanding of a company's goods or services and its competitive advantages is essential to the Main Street value investor. To own a company, we must first understand the business that generates the numbers that comprise the stock's analysis.
The TJX Companies is the leading off-price retailer of apparel and home fashions in the U.S. and worldwide. The company generates $33 billion in revenues from more than 3,800 stores in nine countries and three e-commerce sites.
TJX divides itself into four main business segments: Marmaxx and HomeGoods, both in the U.S., TJX Canada, and TJX International.
Store Growth by segment, fiscal 2016 and 2017 actual plus fiscal 2018 estimated:
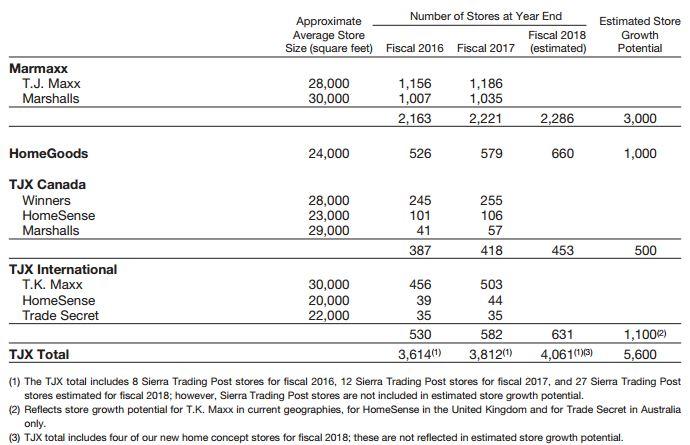 (Source: The TJX Companies)
The Intrinsic Value of a SEC Filing
We sourced the above chart from the company’s Form 10-K Annual Report filed with the Securities and Exchange Commission (SEC) for the fiscal period ending January 28, 2017.
I challenge readers that may be inclined to skip annual reports and other SEC filings to find organizational, product, regulatory, and financial facts about the company that you were previously unaware of, as I often do. To be sure, these documents are largely avalanches of legalese and numbers crunching, but deep dives will often uncover slices of information that bring us virtually inside the company's hallways.
In reviewing The TJX Companies' most recent 10-K annual report, we discovered that:
- Net sales from e-commerce amounted to 1% of total sales in fiscal 2017 (page 26.)
- Selling, general, and administrative expenses increased to 17.4% of net sales in fiscal 2017, up from 16.1% in F2015 (page 27.)
- The effective income tax rate for F2017 was 38.3%, signaling an excellent margin expansion opportunity if corporate income tax rates are lowered by Congress (page 28.)
- Advertising spend was only 1.2% revenues in F2017; a testament to the brand recognition and location dynamics of TJX stores (page F-11.)
For Retailers, a Narrow Moat is Better than None
Within investing parlance, an economic moat is the subjective measure of the competitive advantages of a company's goods or services in the marketplace. A wider moat creates a barrier to entry for potential competitors. Amazon notwithstanding, in the highly competitive specialty retail space, wide moats are uncommon. The TJX Companies' narrow moat is perhaps wider than most retailers, at least for now. According to Morningstar analyst Bridget Weishaar:
Through its off-price retailing model, we believe TJX has achieved significant bargaining power with suppliers. The company offers wholesalers, department stores, and specialty stores the opportunity to clear excess inventory at very favorable terms to the supplier. These stipulations include a willingness to purchase less-than-full assortments of items, styles, and sizes as well as quantities ranging from small to very large. Because TJX is the largest off-price retailer and has international operations, it is uniquely positioned to manage large volume and disperse merchandise across a geographically diverse network of stores and to target specific markets.Although we believe these competitive differences will continue to benefit TJX for at least another decade, we do think they will eventually erode as current competitors increase in scale and invest in more efficient inventory management systems. Additionally, we cannot rule out the threat of new competitors emerging either through traditional or online storefronts. As such, we assign TJX a narrow moat versus a wide one.
To be sure, the TJX portfolio of consumer-favorite store brands that span several age groups are less susceptible to the specialty retail industry’s reliance on teen fads. Thus, the stock is an ideal complement to a buy-and-hold value investor’s commitment to a diversified portfolio of high quality, customer and shareholder-friendly companies.
Superiority in Buying, Inventory, and Management

Ernie Herrman, CEO and President (Courtesy of the The TJX Companies)
When considering the worthiness of a company's inclusion in the Main Street Value Investor Model Portfolio, the emphasis is placed on actual growth metrics as opposed to speculative forecasts of what may or may not occur with future revenues, earnings per share, free cash flow, or dividend growth. We look for positive, trailing five-year increases in revenue, earnings, cash flow, and dividends. As defensive investors, we prefer companies that are already growing, not just promising to grow.
In the most recent five-year period, The TJX Companies’ compounded annual revenue and earnings per share growth rates were 7.43% and 12.34%, respectively. Although in the single digits, the top-line increase is relatively high for an S&P 500 company. Plus, we welcome the double-digit bottom-line growth from any company, big or small.
TJX’s most recent five-year compounded annual dividend growth rate was a shareholder generous 21.1%. Ultimately, dividends keep us compensated in the short term as we wait patiently for capital appreciation of the company's stock over the long term.
Returns on Management
We want to own companies with efficient and transparent management that leverage returns for customers and investors. Led by company veterans, Executive Chairman Carol Meyrowitz and Chief Executive Officer Ernie Herrman, the leadership team and ~235,000 other employees of The TJX Companies are serving customers in nine countries. The group is delivering a trailing 12-month operating margin (EBIT or earnings before interest and taxes) at a competitive 11.37% of revenue, yielding a net profit margin of 6.96%, i.e. trailing 12 months of income after taxes divided by sales. We prefer double-digit margins preceded by a “2” or higher, but understand that low double-digit and single-digit operating and net profit margins are typical in the retail space.
From TJX’s cash flow statement for the fiscal year ending January 28, 2017, we are cautiously optimistic of the increase in five-year average growth in total cash from operations from $3.0 billion in 2013 to $3.6 billion in 2017. TJX’s modest annualized trend in generating cash is further tempered by the company’s recent 8.91% cash flow margin, below our minimum threshold of 10%. Cash flow margin is operating cash flow divided by sales, each measured over the trailing 12 months. Again, we are reminded that retail operations are not typically cash cows because of margin squeezes from inventory costs and pricing competitiveness.
At MSVI, we prefer highly profitable, cash-generating companies that provide margins of safety in a literal sense. Although TJX is growing sales and converting those revenues into free cash flow for potential reinvestment into store growth and shareholder payouts, the growth is nonetheless modest.
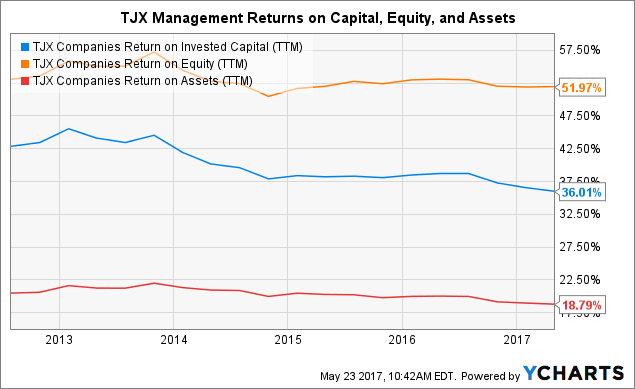
As does Warren Buffett, we place a premium on the return on invested capital (ROIC) or how well a company is allocating its financial resources to generate returns for the business. We target companies producing 12% or higher in ROIC. TJX’s ROIC at the time of this writing was an impressive 36.01%.
The return on capital is only as good as the company’s weighted average cost of capital (WACC). When a business's cost of capital increases, this typically translates to an inverse decrease in valuation and an increase in risk. At just 5.25% WACC, as of this writing, TJX is generating returns on invested capital that are close to seven times the company’s average cost of that capital.
Stock buyback manipulation notwithstanding, the return on equity (ROE) - or how well the company generates net income as a percentage of total equity in the stock - is another excellent measure of management effectiveness. Since we seek a minimum of 15%, we view TJX’s most recent ROE of 51.97% as net positive to the buybacks, and then some.
With a global store footprint and an inventory intensive operation such as TJX, we also want to take a peek at return on assets (ROA) -- i.e., management's ability to use the company assets to generate earnings. As of this writing, the company was leveraging assets at an impressive 18.79%.
Fundamentally, The TJX Companies is a global off-price specialty retailer with $33 billion of modestly growing, new store-dependent annual worldwide sales that are netting single-digit operating margins typical to retail. The company's management team is driving a decent earnings yield and consistent dividend payouts to shareholders.
Where TJX stands out from the crowd are its highly efficient proprietary inventory control systems, superior buyer network, and returns on management that any industry would covet, never mind the pennies on the dollar retail space.
You Get What You Pay For
Determining the attractiveness of a stock's price based on valuation multiples relative to a company's fundamentals is a primary tenet of the Main Street Value Investor's search for stock investing nirvana or alpha.
As of this writing, TJX appears a fairly priced stock of a fundamentally sound company in the context of its stable margins, steady cash flow, and consistent dividends. Current valuation indicators are arguably in the bearish to bullish range depending on an investor's multiple of choice.
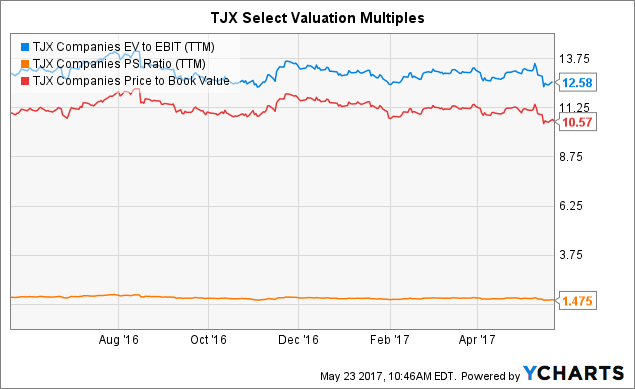
TJX was recently trading at 12.58 times enterprise value to operating margin (EV/EBIT). In general, less than 12 times reflects a reasonable stock price. EV/EBIT is a useful indicator of whether the stock is overbought or oversold in the market. TJX appears trading closer to a market perform level.
The price to sales ratio for TJX was 1.48 times, as of this writing. We interpret <2.00x as a good value when measuring a stock price relative to its revenue stream. TJX’s peers in the specialty retail industry were trading at a slightly lower ratio of 1.05x. However, TJX is in line with the consumer discretionary sector which had a P/S of 1.46x versus 2.05x for the S&P 500.
TJX appears expensive to its competitors when considering its price-to-book or P/B ratio. As of this writing, the stock is trading at 10.57 times its net asset value. We focus on fundamentally sound companies selling at a P/B ratio of less than 2.00 or at least below the industry average. In the case of TJX, its P/B is trading at a premium to the 3.43x of its specialty retail peers.
Some investors prefer a measurement of tangible book where intangible items such as patents, intellectual property, and goodwill are absent from the denominator. As of this writing, price to tangible book for TJX was 10.98 times, reflecting a $196 million of intangible assets on the company’s balance sheet as of April 29, 2017.
Accounting for intangible assets is more often an exercise in balance sheet bloat, and we note TJX’s apparent limited reliance on stating such assets which are down from close to $350 million at the company in 2016.
The price-to-earnings growth ratio (PEG) is a favorite among Wall Street’s growth and momentum crowds. As value investors, we are more cautious based on the projection nature of PEG as opposed to actual trailing results. Nonetheless, PEG can provide a substantive peek into a stock's price worthiness. We prefer a PEG ratio below 2.00, and TJX was recently trading at a bullish 1.54 times based on a five-year growth projection. The specialty retail industry was trading at an identical 1.55x PEG.
The overall bearish market consensus toward on-ground retail may be the driver behind the value-oriented price to growth prospects at the specialty retailers, including TJX.
We also measure cash flow multiples as a reliable predictor of the intrinsic value of a stock price. TJX's price-to-cash flow ratio (P/CF) was 16.19 times compared to 5.91x for the specialty retail industry as a whole. At MSVI, we look for stocks trading at a single-digit P/CF or at least significantly below the sector or industry average. Perhaps TJX is reminding us that it is not the value trap as are several of its peers.
TJX is trading at reasonable valuations when measured against enterprise value, trailing sales, and projected earnings growth, but arguably expensive in terms of book value and cash flow. Overall, the stock’s current price appears reflective of TJX’s strong performance as an industry standout of off-price retail apparel and home goods.
For investors seeking a more attractive stock price based on valuation multiples, TJX may need an external black swan event or another short-sighted internal micro occurrence such as the quarterly earnings miss that occurred on May 16, 2017. The stock dropped over 4% after missing Q1 analyst consensus revenue estimates coupled with senior management providing less than expected near-term profit guidance.
We follow the glorified quarterly Wall Street game of "hit or miss" for primarily one reason: to discover valuation opportunities in the stocks of quality companies. Paraphrasing Warren Buffett, active investors on Wall Street are ultimately serving the patient investors on Main Street.
That written, we do not know what the price will be one, three, or five years from now, never mind next week.
Above Average Company in a Below Average Industry

Happy customer at a T.K. Maxx in Austria (Courtesy of The TJX Companies)
A company's balance sheet liquidity -- e.g., current assets divided by long-term debt (CA/LTD), was a favorite of the father of value investing, Benjamin Graham. Higher than 1.50 is ideal, as we want to own businesses that theoretically can pay down debt at least one and a half times using liquid assets.
Our most recent measure of The TJX Companies' CA/LTD was a solid 3.39 times. In simple terms, the company could pay off its long-term debt obligations more than three times over using liquid assets such as cash and equivalents, short-term investments, accounts receivables, and inventories.
Current ratio (CR) is another simple but telling measure of a company's financial stability. CR is current assets divided by current liabilities, thus the higher above 1.00, the better. TJX’s most recent quarterly balance sheet had a CR of 1.64, demonstrating that liquid assets are more than adequate in funding near-term liabilities, such as accounts payables, accrued expenses, debt service, and income taxes.
The MSVI Model Portfolio ranks TJX’s overall market risk profile as average. We like profitable, dividend paying, narrow to wide-moat companies with low volatility - e.g., TJX's beta at 0.84 is less volatile than the S&P 500 at 1.00 - that have the free cash flow and liquidity to pay its bills, both short and long term. TJX entices us with its earnings per share and dividend growth, balance sheet liquidity, and management returns on capital, equity, and assets, but gives us pause when analyzing its revenue growth; operating, net profit, and cash flow margins; and valuation multiples.
The question begs: does any margin of safety exist in the stock of a company that is the undisputed leader in off-price retail, but carries the typical small margins, is storefront as opposed to online dependent, and has mixed valuation indicators?
Margin of Safety
A stock's "margin of safety" is an estimate of the difference between the intrinsic value of the stock and its current market price. Some professional value investors prefer to calculate a margin of safety with discounted free cash flow projections. For example, Morningstar recently published its view of TJX’s "fair value," at $86.00 per share, about a 14% premium to the stock price as of this writing.
These types of overly sophisticated margin of safety or intrinsic value measurements are what allegedly justify the high fee structure of Wall Street. However, we are suspect of the projection nature of these formulas. If we have to start predicting future cash flows, interest rates, and capital expenditures, haven't we become more a speculator and less an investor?
At Main Street Value Investor, we take a modest and frankly realistic approach to estimating margins of safety. We prefer to measure intrinsic values in a broader sense as opposed to Magic 8 Ball specificity. Wall Street, in general, continues to regurgitate intricate, assumptive financial models of predominantly pie in the sky price targets. If those models consistently worked, wouldn't we all be overnight stock market millionaires?
To the contrary, the MSVI Margin of Safety calculation (MoS) follows a concept created by infamous value investor and author Joel Greenblatt that looks for cheap stocks with good earnings yields (EY), ROIC, and cash flow margin (CFM). We simply add the sum of EY, ROIC, CFM, and the reciprocal EBIT/EV, and weigh against CA/LTD to determine the overall profitability, management effectiveness, cash flow, market valuation, and financial stability of the company.
We believe our Greenblatt-based calculation of margin of safety is a useful measure of a company's intrinsic worth based on current and trailing indices as opposed to assumptive future cash flows and other crystal ball projections.
In contrast to the one-year get in and get out laddering approach of Greenblatt's theory - similar to the Dogs of the Dow philosophy - we measure MoS for longer-term value investing as opposed to shorter-term value trading.
As of this writing, the Main Street Value Investor margin of safety rating for TJX reiterates a bullish view based on our expanded formula.
TJX: EY of 4.74% + ROIC of 36.01% + CFM of 8.91% + EBIT/EV of 7.92% = MSVI MoS of 57.58%.
- 32.00% and higher MoS is interpreted as bullish.
- 20.00% to 31.99% MoS is interpreted as neutral.
- 19.99% or lower MoS is interpreted as bearish.
As of April 30, 2017, TJX held the second highest margin of safety rating of all the stocks in the Main Street 20 Watchlist. Johnson & Johnson (JNJ) was number one on the Watchlist on that date. When bordering on any tier, we weight holdings against CA/LTD to make the final MoS determination. Because of the company's strong balance sheet, TJX needs no such tie-breaker.
It is important to stress that our measure of margin of safety is a screenshot of our research and not a buy, hold, or sell signal.
We own common shares for the long-term benefit of partnering with a company that supports its customers with in-demand, useful products or services, rewards its employees with sustainable career opportunities, and compensates its shareholders with positive returns protected by world-class internal financial controls.
However, attempting to predict explicit future prices or percentage gains and declines is a Wall Street game that we respectfully choose to avoid on Main Street.
Hedge Funds are Shopping Elsewhere; Do We Care?
 Paid for by capital gains and dividends, or investor fees? (Bykst/Pixabay)
As Main Street value investors, we do not interpret market consensus as a definitive buy or sell signal, but a suggestion to perhaps run the other way. However, evaluating the Wall Street consensus on a stock is an entertaining if not serious dive into a contrarian's treasure trove.
According to data miner TipRanks, the Wall Street analysts' consensus on TJX based on the models of nine analysts is bullish with a price target of $83.63, a 11% upside to current trading levels.
The financial blogger consensus, including contributors from Seeking Alpha, is bullish per TipRanks. At MSVI, we place most weight on the blogger consensus as it tends to be more of a Main Street view, although we are mindful that many bloggers focus on fundamentals, growth, and dividends, not necessarily value.
Short interest, or the percentage of shares that are traded based on a bet the stock price is poised to drop, was bullish for TJX at 1.3% of shares outstanding as of this writing. We think of short interest as the hedge fund consensus since the Wall Street money manager elite executes a significant shorting of stocks. Per TipRanks, hedge fund holdings of TJX had decreased in the most recent quarter, suggesting a bearish view.
A unique contribution of the Main Street Value Investor series is the measurement of employee satisfaction, including the rank and file's evaluation of the CEO. Although gathered from non-scientific data of the all-too-biased Internet, we believe a snapshot look at employee morale is worth the peek to quantify a company's cultural dynamic.
According to Glassdoor, approximately 1,400 alleged present and former employees of The TJX Companies that submitted online reviews have collectively rated the company 3.4 out of 5 stars. The most-cited positive comment is "best work-life balance in retail." The most mentioned drawback is "hard to progress down a visual merchandising career path." Welcome to the American workplace. Nevertheless, 3.4 is a relatively average score on Glassdoor.
Based on 68 reviews, TJX employees give CEO Ernie Herrman an 84% approval rating. Ernie took over the CEO role in January 2016, thus the small sample size. Nevertheless, anytime a company CEO is respected - or disrespected - by those that work within the same culture as him or her; we take notice.
Satisfied employees’ producing quality products and services typically translates to loyal customers and sustainable profitability.
Why Not Buy Amazon Instead and Be Done with Retail?
Amazon is arguably the undisputed king of retail having achieved this status in just 20 years with legendary growth led by founder and CEO, Jeff Bezos.
However, does that mean we should forsake all traditional retailers as dinosaurs-in-waiting and allocate our retail sector investment dollars, if any, to Amazon?
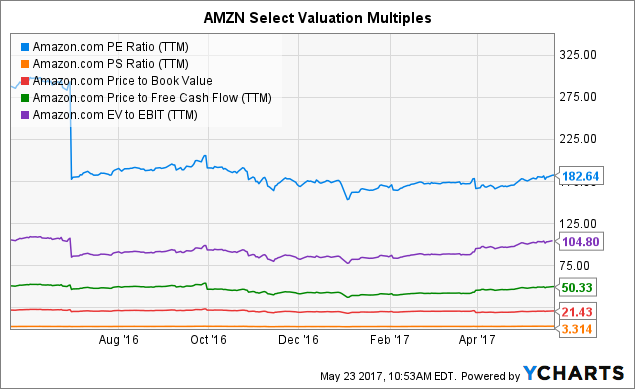
As value investors, the answer lies in the numbers, specifically valuation and margin of safety. As of this writing, AMZN is trading at 182.64 times earnings, 3.31 times sales, 21.43 times book, 50.33 times free cash flow, and 104.80 times EV/EBIT. How much is that doggie in the (device) window?
To be sure, the speculative PEG ratio of AMZN is at a value investor-friendly 1.41x. But that makes sense for a growth company, although virtually all other valuation metrics put Amazon literally in the cloud.
Amazon’s MSVI margin of safety rating works out to an EY of 0.01% + ROIC of 6.83% + CFM of 7.71% + EBIT/EV of 0.01 = MoS of 14.56% weighted against a CA/LTD of 5.13 times. Despite the company’s solid balance sheet, AMZN’s margin of safety is as bearish as a stock price gets at Main Street Value Investor.
No doubt, had I accidentally stumbled upon Amazon during its IPO or the post dot-com crash, I would be singing its praises from an infinity pool overlooking the Caribbean. Then again, you can bet that all of my other accidents that actually lost money on similar speculative trades would be kept secret just as my bad night at the casino.
Readers may justifiably present better retail alternatives to TJX. From our long-view value investor perch (at a desk not an infinity pool by the way) we think TJX remains best in class from the retail sector.
No comments:
Post a Comment