From trough to table: mapping the food chain saves livesTracking produce prevents the spread of disease and tackles food fraud
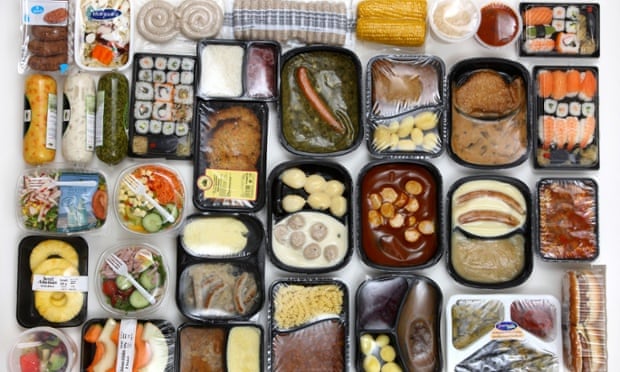
The use of mapping technologies makes it easier to ensure that no unexpected ingredients end up in our food. Photograph: Jochen Tack/Alamy
Simon Thompson
Friday 16 January 201507.26 EST
Nearly half of global manufacturers say they don’t have any visibility past their direct suppliers – in other words, they don’t know what is happening in their supply chain. While they may audit first tier suppliers, they usually cannot see beyond them to their suppliers’ suppliers.
In the food industry, a meat packaging plant buys meat from a supplier, which in turn buys beef from multiple farms in an area. The packaging plant keeps records on its supplier, but does it know the cleanliness ratings and health history of those farms?
Applying higher standards to information collection and management will reducethe impact animal disease has on global food production and have huge public health benefits. Last year, faecal matter was found in more than 80% of ground turkey in 21 states across the US. The US Centers for Disease Control and Prevention found salmonella not only in poultry, but also in bean sprouts, nut butter, chia powder and cheese. It estimates that, each year, roughly one in six Americans get sick, 128,000 are hospitalised and 3,000 die from food-borne diseases.
Consumers with religious and cultural reasons for not eating certain foods should also be concerned about supply chain transparency. When pork was found in Ikea’s moose lasagna, sold in Europe, many in the Jewish and Islamic communities were upset. And in Malaysia, a predominantly Muslim nation,Cadbury’s suffered a major hit when swine DNA was found in candy bars. These events leave many wondering how it happened and what other cross-contaminations remain undiscovered.
Researchers are finding that popular products include more than the content on their packaging. Honey, maple syrup and orange juice are just a few examples of foods regularly enhanced with corn syrup.
Advertisement
Yuck factor aside – horsemeat found in beef products in the UK left many consumers feeling queasy – some substitutions and contaminations can also be dangerous. Olive oil is one of the most frequently adulterated foods. Its health benefits are well publicised and extra virgin oil demands a premium price. Yet some producers have been found using less expensive oils to cut costs, including nut oils. This reduces the quality of the olive oil; more importantly, substituting nut oils can be life-threatening to those with allergies.
A bright spot in all this is food testing. It not only ensures food quality and safety, but also prevents food fraud, which costs the global food industry an estimated $30bn-$40bn (£19.7bn-£26.3bn) each year (pdf), according to the Global Food Safety Initiative.
Where transparency is concerned, understanding the location of each point in the journey food travels from trough to table is essential. One of the best ways to achieve this is through mapping.
By linking geographic information (all the locations that, for example, the ground meat, lettuce, cheese and sesame seed bun come from) to non-spatial data (the name and lot number of the cow, and the firm processing it), it’s possible to simplify the complex web of origins and process points so food chains can be more easily understood, accessed, traced and tracked.
In 2004, an outbreak of avian influenza in British Columbia, Canada, led to more than $500m (£330m) in damages and lost productivity. In 2007, the Canadian province of Manitoba took part in an exercise replicating the same outbreak. They found that waiting until an outbreak occurred to collect and map information on food production premises was unreliable and slow.
As a result, the government of Manitoba implemented a mandatory identification program using a geographic information system (GIS) that required assigning a unique number to any premise in the province where livestock and poultry were grown, kept or disposed of. The government created precise knowledge about the location of livestock along with information on legal land descriptions, owners, emergency contacts and animal information.
This data is now used to track and visualise disease spread and identify ways to contain and eradicate it. Not only is it more efficient, cost effective and quicker than traditional door-to-door investigations, it’s also more accurate and easier to oversee.
Collecting this data is not as daunting as it might seem. Most farm equipment has built-in GPS that collects and logs location data automatically. This data is easily shared, managed, analysed and viewed in a GIS. GPS data becomes valuable information about how people, livestock and products move between locations and how food products are processed. When cows are sold to new owners, there is a history of where they came from. Should one farm be involved in an incident or outbreak, the impact and implications can quickly be assessed and measures taken to correct or mitigate future problems.
GIS technology is not expensive, enabling even small farms and local suppliers to access online tools to import, view, track, share and analyse their production data, as well as multinational conglomerates of course. Farmers can more easily provide information on where every crop or animal is grown or raised for accountability. Contractors, third-party businesses, government agencies and insurance companies have evidence of every ingredient’s journey as it passes their doors. In turn, this transparency can be used to help consumers feel less anxious about the safety of their food.
No comments:
Post a Comment