Big Data Analytics Use Cases
 Are you data-flooded, data-driven, data informed? Are you outcome oriented, insight driven or hindsight driven?
Are you a firm where executives claim – “Data is our competitive advantage.” Or sprout analogies like, “data is the new oil”.
The challenge I found in most companies is not dearth of vision… everyone has a strategy and a 100,000 ft general view of the importance or value of data. Every executive can parrot the importance of data and being data-driven.
The challenge is the next step….so, how are you going to create new data products? How are you going to execute a data driven strategy? How are you going to monetize data assets? What are the right business use cases to focus on? How to map the use case to underlying models and data requirements? What platform is a good long-term bet? The devil is in these details.
Everyone is searching for new ways to turn data into $$$ (monetize data assets). Everyone is looking for new levers to extract value from data. But data ingesting and modeling is simply a means to an end. The end is not just more reports, dashboards, heatmaps, knowledge, or wisdom. The target is fact based decisions, guided machine learning and actions. Another target is arming users to do data discovery and insight generation without involving IT teams…so called User-Driven Business Intelligence.
In other words, what is the use case that shapes the context for “Raw Data -> Aggregated Data -> Intelligence -> Insights -> Decisions -> Operational Impact -> Financial Outcomes -> Value creation.” What are the right use cases for the emerging hybrid data ecosystem (with structured and unstructured data)?

 What are your Use Cases by Industry or Function?

I see this every day at clients. Many organizations flounder in their Analytics, Data Science and Big Data efforts not because they lack smart talented people or analytics capability but because they lack clear objectives, leadership, experimental mindset or multi-year roadmaps in converting noisy hybrid data into useful signals.
So the first question is: What do you really want to achieve? Increased customer loyalty? Better customer engagement? A greater share of wallet via cross-sell? New customers? Lower attrition? Cheaper and faster data processing? In other words, what is the use case? As the old adage goes: if you don’t know where you are going, any road will get you there.
Starting with a clear objective is essential in order to pick the right tool to solve the right problem. Some clarity is necessary to drive proof of concepts or even select a technology stack to experiment with.
Big Data Analytics promise: enable “data monetization” through more timely, more accurate, more complete, more granular, more frequent decisions. So, what exactly are the types of business problems big data analytics likely to solve? For this you need a mini-MBA in Big Data Use Cases.
 Industry specific vs. Process specific Use Cases

Use cases described here are meant to stimulate ideas of how to apply iterative big data analytics in your own organization and enable your own analytics center of innovation.
Some interesting Big Data use cases I have come across include:
- Healthcare Providers — The challenge for hospitals, especially as cost pressures tighten, is to treat more patients more efficiently, while improving the quality of care. In care coordination and management, machine and instrument data is being increasingly leveraged to track and optimize treatment, patient flow, and equipment use in hospitals. It is estimated that a 1 percent efficiency gain could yield more than $63 billion in global health care savings. See this posting for more details.
- Insurance — Individualize auto-insurance policies based on newly captured vehicle telemetry data. Insurer gains insight into customer’s driving habits delivering: (1) More accurate assessments of risks; (2) Individualized pricing based on actual individual customer driving habits; (3) Influence and motivate individual customers to improve their driving habits
- Travel — Optimize buying experience through web/mobile log and social media data analysis (1) Travel site gains insight into customer preferences and desires; (2) Up-selling products by correlating current sales with subsequent browsing behavior Increase browse-to-buy conversions via customized offers and packages; (3) Deliver personalized travel recommendations based on social media data
- Gaming — Collect gaming data to optimize spend within and across games: (1) Games company gains insight into likes, dislikes and relationships of its users; (2) Enhance games to drive customer spend within games; (3) Recommend other content based on analysis of player connections and similar “likes” Create special offers or packages based on browsing and (non-)buying behavior
- Predictive Maintenance using sensors (or motes) — For instance, high-end cars use telemetry to know that an engine part is likely to break down before it actually does, based on the vibration or temperature patterns, a technique known as predictive maintenance. The idea is that a part does not fail all at once. Instead, it deteriorates over time until it eventually breaks. By monitoring the part real-time, you can spot problems before they become obvious. (I heard that one entrepreneur is putting a wireless sensor in a diaper so they can alerts parents to the need for “proactive” care on their infants.)
- Energy Management — many firms are using big data for energy management, including energy optimization, smart-grid management, building automation and energy distribution in utility companies. The use case is centered around monitoring and controlling network devices, manage service outages, and dispatch crews. It gives utilities the ability to integrate millions of data points on network performance and lets engineers use analytics to monitor the network.
First, let’s define what makes data Big to set some context.
Big Data, Little Data
 We live in a world of data: transactions, feedback, and realtime interaction with customers, partners, suppliers, and employees. Big data is where the volume, velocity, variety, verticalization (context) and value of the data itself is now part of the problem.
3 reasons why we are generating data faster than ever:
• Processes are increasingly automated
• Systems are increasingly interconnected
• People are social and increasingly generate data exhausts by interacting online
• Systems are increasingly interconnected
• People are social and increasingly generate data exhausts by interacting online
Data, in general, falls into 3 categories:
- Business application data (e.g., SAP or Oracle ERP)
- Human-generated content (e.g., social media) and
- Machine data (e.g., RFID, Log Files etc.).
In addition to brick, click and mobile business app transactions, the new variable in the mix is Human generated data — explosive growth of blogs/reviews/messages/emails/pictures. The Twitter firehose alone generates 7+ terabytes — 10s of millions of tweets per day and is growing rapidly. Facebook is estimated to generate 10+ terabytes a day. Social graphs such as product recommendations based on circle of friends, jobs you may like (linked in), products you have looked at, people who are your contacts etc also create “second order” data that can be mined for sentiment analytics on products or companies or fact discovery.
Another new variable is machine generated data. Computers generate data as byproduct of interacting with people or other with other device. More interactions, more data. This data comes in a variety of formats from semi-structured log files to unstructured binaries. This “exhaust fumes” of data can be extremely valuable. It can be used to understand and track application or service behavior so that we can find patterns, errors or suboptimal user experience. We can mine it for statistical patterns and correlations to generate insights.
However, if you listen to the hype, companies can harness this information learn faster, make better decisions, and stay one step ahead of their competitors. Unfortunately, harnessing big data (and separating the signal-from-noise) is trickier than it looks. It takes a lot of skill and superb understanding of use cases.
Big Data Use Cases
Science + Use Case + Scale = Big Data. The key to exploiting Big Data Analytics is focusing on a compelling business opportunity as defined by a use case — WHAT (What exactly are we trying to do?); WHAT value is there in proving a hypothesis?

A use case is at the core of any big data strategy. Most people don’t get this. In most companies, the charter for big data will be given to those who already have responsibility for IT, business intelligence or marketing. But what happens after the CEO hands you the big data portfolio?
What is the use-case framework that will shape a big data strategy, understand the issues of managing data, and learn how data science can be used to create value.
Use cases are emerging in a variety of industries that illustrate different core competencies around analytics.
A big data Use Case provides a context for a value chain: how to move from “Raw Data -> Aggregated Data -> Intelligence -> Insights -> Decisions -> Operational Impact -> Financial Outcomes -> Value creation.”
Figure below illustrates some Use Cases along two dimensions: data velocity and variety.

Source: SAS and IDC
E-tailing – E-Commerce – Online Retailing Use Cases
e-tailers like Amazon.com are constantly creating target offers to boost customer lifetime value (CLV); deliver consistent cross-channel customer experiences; harvest customer leads from sales, marketing, and other sources; and continuously optimize back-end process orchestrations.
- Recommendation engines — increase average order size by recommending complementary products based on predictive analysis for cross-selling.
- Cross-channel analytics — sales attribution, average order value, lifetime value (e.g., how many in-store purchases resulted from a particular recommendation, advertisement or promotion).
- Event analytics — what series of steps (golden path) led to a desired outcome (e.g., purchase, registration).
- Right offer at the right time
- Next best offer – deploying predictive models in combination with recommendation engines that drive automated next best offers and tailored interactions across multiple interaction channels.
- Site/Content/Experience Personalization — Data making creative smarter and more personal
- True-lift modeling and analytics — aimed at “Stopping spending direct marketing dollars on customers who would purchase anyway! The goal of analytics is to identify:
- which customers will purchase without receiving a marketing contact
- which customers need a direct marketing nudge to make a purchase
- which customers have a negative reaction to marketing (and purchase less if contacted)
So how big is the data on which the algos have to operate? Consider this…in 2014 eBay’s “Singularity” Teradata warehouse exceeds 40 petabytes. According to eBay, the company’s data volumes are 50+ terabytes per day in new incremental data, processing 50+ petabytes and tens of millions of queries per day, with 99.98% availability and more than 50 petabytes of online storage.
Interesting Use Case – Amazon Will Pay Shoppers $5 to Walk Out of Stores Empty-Handed
Interesting use of consumer data entry to power next generation retail price competition…. Amazon is offering consumers up to $5 off on purchases if they compare prices using their mobile phone application in a store. The promotion will serve as a way for Amazon to increase usage of its bar-code-scanning application, while also collecting intelligence on prices in the stores.
Amazon’s Price Check app, which is available for iPhone and Android, allows shoppers to scan a bar code, take a picture of an item or conduct a text search to find the lowest prices. Amazon is also asking consumers to submit the prices of items with the app, so Amazon knows if it is still offering the best prices. A great way to feed data into its learning engine from brick-and-mortar retailers.
This is an interesting trend that should terrify brick-and-mortar retailers. While the real-time “Everyday Low Price” information empowers consumers, it terrifies retailers, who increasingly are feeling like showrooms — shoppers come to to check out the merchandise but ultimately decide to walk out and buy online instead. See Multi-channel to Omni-channel Retail Analytics: A Big Data Use Case
Retail/Consumer Use Cases
- Targeted digital offers
- Price optimization, Merchandizing and market basket analysis for better yield management
- Campaign management and customer loyalty programs
- Supply-chain management and analytics
- Event- and behavior-based targeting
- Market and consumer segmentations – identifying granular audiences
- Real Social Relationship models – audience bundles and look-alike modeling that leverage social connections and interests
- Sell-thru models – building third party ecosystems
- Customer scoring
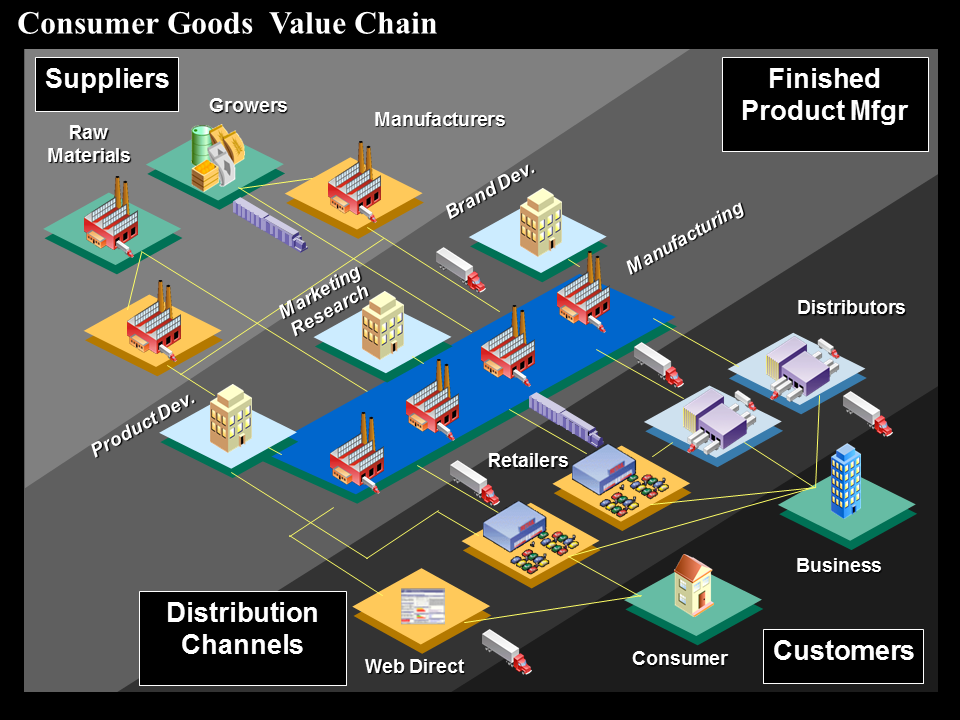 Big Data Analytics History: In the 1980’s, the CPG / Retail industry transitioned from bi-monthly audit data to scanner data changed the dynamics of the industry. RFID is transforming the supply chain. Combining data from a diverse set of data resources— adding customer sentiment data, geolocation data, customer preference analysis, and market trending information based on contextual text analytics, all add up to provide a level of sophistication previously unavailable to the industry.
Predictive analytics is well understood by the retail industry. Retailers want to predict factors that might be important for a buyer to make a purchasing decision before that product ever was stocked on shelves. What if retailers could know exactly what market dynamics were modifying demand curves before they occurred? Imagine the impact on operational efficiencies in terms of inventory cost control, intelligent distribution and routing, and demand projection. The retail Use Cases are quite varied.
Food Retailing Use Case — For food retailers the fresh food category is important for customer satisfaction. Providing sufficient stocks while avoiding food waste makes for customers happy and keeps the retailer profitable. Many retailers are exploring how a fully automated, data-driven replenishment process is possible based on internal and external data sources combined with advanced predictive analytics. Some retailers are using data lineage to address “origin-to-destination” food ingredient safety issues.
Below is an interesting Hadoop for Retail architecture from Hortonworks.

Financial Services Use Cases
Financial Services is an information centric industry. As a result, analytics is critical across the FS value chain. This value chain contains 4 tiers – suppliers, product providers, channels, and customers. Providers include banks, insurance, capital markets firms and asset management companies. Regulators monitor all activities within the industry. In the multi-tier distribution channel agents include RIAs, insurance agents, commodities agents, and mutual fund agents.
- Compliance and regulatory reporting
- Risk analysis and management
- Fraud detection and security analytics
- CRM and customer loyalty programs
- Credit risk, scoring and analysis
- High speed Arbitrage trading
- Trade surveillance
- Abnormal trading pattern analysis
Risk Modeling Use Case — A large financial institution took separate data warehouses from multiple departments and combined them into a single global repository in Hadoop for analysis. The bank used the Hadoop cluster to construct a new and more accurate score of the risk in its customer portfolios. The more accurate score allowed the bank to manage its exposure better and to offer each customer better products and advice.
Trade Surveillance Use Case — A large investment bank combines data about the parties that participate in a trade with the complex data that describes relationships among those parties and how they interact with one another. The combination allows the bank to recognize unusual trading activity and to flag it for human review.
Underwriting Use Case — ZestCash uses online data to determine the credit worthiness of new customers, offering a more modern way of underwriting. Instead of relying on tools like FICO scores, ZestCash pulls in a wealth of data to help rank a person’s likelihood of defaulting. Using data like cell phone bill payments or the length of stay at a residence help provide a fuller picture about a person’s ability to pay off loans.

Regulatory Monitoring – Regulatory oversight and regulations are being created or extended to cover more financial markets and market scenarios to try to close gaps or loopholes that may have contributed to the financial crisis. Pressure to monitor all aspects of financial institutions has created a new patchwork of regulatory regimes. Some regulations are quite prescriptive in terms of what, where, when and how to manage data.

Fraud Use Cases
Fraud management helps improve customer profitability by predicting the likelihood that a given transaction or customer account is experiencing fraud.
Solutions analyze transactions in real time and generate recommendations for immediate action, which is critical to stopping third-party fraud, as well as first-party fraud and deliberate misuse of account privileges.
Solutions are typically designed to detect and prevent a wide variety of fraud and risk types across multiple industries, including
- credit and debit payment card fraud;
- deposit account fraud;
- technical fraud and bad debt;
- healthcare fraud;
- Medicaid and Medicare fraud;
- property and casualty insurance fraud,
- workers’ compensation fraud.
Global payment card fraud detection Use Case. The goal is to analyze payment card transactions in real time, assesses the risk of fraud, and takes the user-defined steps to prevent fraud while expediting legitimate transactions. To enable this objective predictive models and profiling technology are used to examine transaction, cardholder and merchant data to detect a range of credit and debit card fraud quickly and accurately.
To improve fraud detection rates, merchant profiles are often pre-built. Merchant profiles are built using fraud and transactional data that include characteristics that reveal merchants that have a history of higher fraud volumes, and which purchase types and ticket sizes have most often been fraudulent at a particular merchant.
Healthcare and Workers Compensation Use Case — uses predictive modeling to detect claims fraud, abuse and errors before payment identifies suspicious providers as soon as aberrant behavior patterns emerge.
Auto and P&C Insurance Fraud Use Case — Fraud and risk segmentation is a very real challenge for insurance companies around the world. Whether fraud is on a large scale, such as arson, or involves a smaller claim such as an inflated auto repair bill, payouts for fraudulent claims cost companies millions of dollars every year – and that cost gets passed down to the customer in the form of higher insurance premiums.
So a typical use case is to use analytics to catch fraud early by leveraging data from incoming claims, assess each claim against identified risk factors and segment claims into various risk categories – likely fraudulent claims to higher-risk to low-risk cases.
Value of analytics — Fraud losses accounted for 6 to 10 percent of annual premium costs for Insurance customers. Fraud is also getting very corporate – run by crime syndicates. And fraud had another consequence – poor operational efficiency. Because agents had to handle and investigate both high- and low-risk claims, all claims take a long time to settle. The target for most firms is resolution in less than an hour for some customers.
Web & Digital Media Services Use Cases
Competition is brutal for media companies in the digital world with a small percentage of consumers driving most revenue. Media companies must understand consumer behavior: analyzing content-consumption, demographic, social media and transactional data. With these insights they can create personalized experiences, highly-targeted marketing and digital advertising.
Much of the data media firms work with is the direct consequence of Web 2.0. Customers generate a trail of “data exhaust” that can be mined and put to use.
- Large-scale clickstream analytics for precision targeting
- Ad targeting, analysis, forecasting and optimization
- Abuse and click-fraud prevention
- Social graph analysis and profile segmentation
- Campaign management and loyalty programs
Clickstream Use Case — Big Box Retailer need to analyze their clickstream — §3.5 billion records; 71 million unique cookies; 1.7 million targeted ads required per day. The problem: how to improve Return on Ad Spend (ROAS). Also how to speed up the analytics so consumers get more relevant ads quicker, which is especially important during holiday seasons!
Suggestion Use Case. Yelp is growing rapidly and with more than 50 million of monthly visitors and 18 million or reviews the company generates about 400GB of data a day. That data needs to be processed and analyzed. A simple use case is Spelling Suggestions. By looking at millions of misspelled words Yelp uses an algorithm to create suggestions for common misspellings. By looking at typical queries, yelp can list common suggestions for a query even before you finish typing. This is possible because Yelp analyses all the web logs from their websites.
Predictive Search Use Cases
Analytics as a core strategy enabled by big data is happening. A range of start-ups – Cue, reQall, Donna, Tempo AI, MindMeld and Evernote – and big companies like Apple, Google are working on what is known as predictive search — new tools that act as personal valets, anticipating what you need before you ask for it.
Google, for instance, is continuously changing the landscape of search with predictive analytics.
Google launched the practice of predictive search back in 2004 with Google Suggest, which was then renamed to Google AutoComplete in 2010. In 2010, Google Instant came on the scene, generating search results instantly as users type. Google’s Knowledge Graph in 2013 further enhances predictive search by predicting what type of information a user is searching for when they search a celebrity name “Brad Pitt” and generates specific related content right alongside normal search results.
Google Now is the next generation of predictive search, serving as a valet or personalized assistant that can predict your needs, wants, and deep desires. This is basically taking multiple buckets of data and intelligently connecting them to facilitate decisions….everyday data supported decision making. For some, Google Now delivers important information about the traffic on your morning commute, your updated flight itinerary, and the results of last night’s hockey game on your phone, without you even asking.
How does Google Now work….In order to provide relevant contextual info that relates to you and only you, Google uses your private data, accessing your location, Gmail, daily calendar, and other info in order to keep tabs on things like appointments, flight reservations and hotel bookings. Or auto-suggesting restaurants from the Zagat’s guide to have dinner at.
Google Now is evolving and forms a key foundational element for Google Glass. For instance, you are running thru the airport wearing Google Glass, which uses its predictive powers to send a gate change or flight delay alert as a Glasshole arrives through the airport.
Having Android on every smartphone and their own Moto-X allows Google to do extremely creative things enabling more and more of the augmented reality revolution going forward.
Government Use Cases
- Fraud detection
- Threat detection
- Cybersecurity
- Compliance and regulatory analysis
- Energy consumption and carbon footprint management
Threat detection Use Case : A federal law enforcement agency has a challenge: how does it monitor threat (or criminal) behaviors and communications in order to raise awareness of interdiction opportunities while also exposing non-obvious relationships between terrorist actors/agents? Using massive amounts of data from numerous data sources, how could the agency proactively engage and disrupt planned criminal activities? And how can the agency execute on these needs in a cost effective and efficient manner—exposing information to partner organizations as appropriate. See NSA PRISM post for more details
Infrastructure Threat Use Case: As utilities in the U.S. add information technology to their grids new threats are emerging. Efficiency is also making the grid even more vulnerable to security concerns as grid could be hacked (or face some variant of a denial of service attack) by people and nations that could use it to their advantage.
Civil Aviation use Case: The FAA is continuously looking for ways to advance the safety, security, and efficiency of civil aviation. This requires analysis of a diverse set of airline, surveillance, weather, terrain, and infrastructure data. There is a growing focus on how to use Hadoop to fuse and analyze these data sets, based on statistical inference of textual, temporal, and geospatial features.
New Applications
- Sentiment Analytics
- Mashups – Mobile User Location + Precision Targeting
- Machine-generated data, the exhaust fumes of the Web

Social Gaming: Zynga in their S-1 filing claimed that “they process and serve more than a petabyte of content for players every day, a volume of data that is unmatched in the social game industry. We continually analyze game data to optimize our games. We believe that combining data analytics with creative game design enables us to create a superior player experience.”
Online Dating Use Case: A leading online dating service uses sophisticated analyses to measure the compatibility between individual members, so that it can suggest good matches for a potential relationship.
Big Data Analytics helped customers find romance. Modeling human attraction… especially mutual attraction is a lucrative big data problem and use case. The algorithms that power Match.com are not very different than those that are behind LinkedIn.
Healthcare & Life Sciences Use Cases
- Health Insurance fraud detection
- Campaign and sales program optimization
- Target offers (Front of the stores, Co-Pay Cards)
- Customer Lifetime Value (customer scoring)
- Brand management
- Care Management
- Patient care quality and program analysis
- Medical Device and Pharma Supply-chain management
- Drug discovery and development analysis
- Clinical trail optimization
- Patient Engagement
- Health Behavior Modification
- Prescription Adherence
- Prescription Fulfillment
National healthcare expenditure is estimated to be $3 Trillion in 2012. Obviously there is enormous amount of waste that can be trimmed with better insights and analytics.
The Healthcare Provider value chain consists of 4 tiers – suppliers, payors/regulators, providers, and patients. Healthcare providers include hospitals, long term care facilities, outpatient care offices (e.g. doctor’s, labs) and integrated networks (e.g. Kaiser). Regulatory agencies monitor activities such as transaction costs and increase consumer confidence in this industry.
The focus of analytics across healthcare provider value chain globally is (1) cost reduction (healthcare spend), (2) productivity and operational improvements, (3) drug discovery and clinical trials and (4) efficiency/outcomes (effective and economical treatments for chronic illnesses and other common diseases).

Health Care Payer Analytics
With respect to Analytics, the large private payors was waking up to the potential. They have setup stand-alone analytics divisions, such as OptumInsight for United Health, ActiveHealth for Aetna, and HealthCore for WellPoint. These divisions provide services to other payors that include support on data-driven issues like cost and performance benchmarking.

The type of use cases around healthcare spend (cost reduction), patient impact (outcomes) and disease management include:
Analyzing Electronic Health Records (EHR). The use case is aimed at aggregating and analyzing all of the patient Electronic Health Records (EHR) from hospitals and other healthcare providers and make them available online to doctors as they are examining the patients. This aims to bring down the cost of providing healthcare by sharing patient information between providers to reduce ordering duplicate tests and reduce the time taken to provide patient care. Current EPIC solution (similar to an ERP for hospitals) does not allow having more than a few months of historical patient information available online. Also, the current solution takes several minutes to search historical EHR records.
Hospital Care Data Analysis. Instead of taking readings every few hours, a hospital continuously recorded data from all the medical instruments in a pediatrics ward. By capturing data and analyzing it and looking at it from maybe five or six different points of view, the analytics team was able to help the physicians spot an infection trends 12 to 24 hours earlier than they may have spotted it. That allowed doctors start a course of treatment that let them save the lives or shorten stays.
Risk Management Use Case – Kaiser Permanente collects petabytes of health information on its 8-million-plus members, a fantastic amount. Some of this data was used in an FDA-sponsored study to identify risks with Vioxx, Merck’s pain medication, which was pulled shortly after the research identified a greater risk of heart attack in a subset of the patient population.
According to Kaiser Permanente — “With our electronic medical record system, we’ve become much more data driven and analytics oriented. Pretty much every actor in the care delivery system is using the same record and entering information in the same place. That allows us to do some remarkable things with regard to thinking about where and how members should receive care, and how to improve the flow of information, while at the same time lowering costs.”
Comparative Effectiveness Use Case. Payors like Cigna, Aetna, Blue Cross and Blue Shield network and others are combining data from the pharmaceutical clinical trials with proprietary data to conduct comparative-effectiveness studies. Payers know more about drug performance data in some situations than the large pharma firms themselves. This gives payors a distinct advantage in negotiating payments. It also made it difficult for Pharma to get their drugs represented on national and country formularies, the all important drug approval lists from which physicians prescribe medications. How are pharma firms like Pfizer, AstraZeneca, GSK, Roche, BristolMyers and BioGen responding to this competitive disadvantage? They are investing and ramping up their own analytics program, partnering with data providers like IMS Health, Symphony Health or HealthCore, a clinical outcomes research subsidiary of health insurer WellPoint Inc.
Range of Healthcare use cases is quite diverse across different areas shown in the figure below (Source McKinsey Healthcare).

Telecommunications Use Cases
- Revenue assurance and price optimization
- Customer churn prevention
- Campaign management and customer loyalty
- Call Detail Record (CDR) analysis
- Network performance and optimization
- Mobile User Location analysis
Telecom Use Case: A large telco provider analyzed call logs and complex data from multiple sources. The use case calls for batch aggregation and analysis of web logs, network base station logs and network signaling traffic for data mining and network route optimizations. The goal is to use the log data to build customer profiles (popular cellphone devices, popular websites etc), segment the customers, and optimize products and services accordingly.
Cell Phone Provider Use Case: Very large cellular service provider (>50M subscribers) needed to provide online access to customer cellphone call, SMS and web data records to their subscribers. The CDR data adding upto 30 TB of data every month and about 60 billion records added every month. The traditional database solution is not an option given the volume of data and the requirement for providing online access to call and billing history to the subscribers. The CDR data is stored on an 80 node HBase cluster. The CRM system directly reads data from HBase cluster for presenting monthly billing history.

Below is an interesting Hadoop for Telecommunications architecture from Hortonworks.

Utilities Industry Use Cases
Utilities run big, expensive and complicated systems to generate power. Each grid now includes sophisticated sensors that monitor voltage, current, frequency and other important operating characteristics. Efficiency now means paying careful attention to all of the data streaming off of the sensors.
Take for instance, Southern California Edison which is collecting hourly (rather than monthly) data on customer usage from new digital smart meters in millions of resi- dences. It will soon be monitoring and giving frequent feedback to customers about their energy use, a significant benefit for energy grid management and customer service.
Utilities are now leveraging Hadoop clusters to analyze generation (supply) and consumption (demand) data via smart meters.
Smart meters — The rollout of smart meters as part of the Smart Grid adoption by utilities everywhere has resulted in a deluge of data flowing at unprecedented levels. Most utilities are ill-prepared to analyze the data once the meters are turned on.
So, What’s the Big Deal?
The big deal is that if either insight or hindsight analytics are done well as shown in the figure there is room for margin expansion and additional profit.

Summary
Big Data is full of valuable, unanswered questions! The challenge is separating the actual predictive indicators — signal from the noise — in the data. Similarly big data analytics will facilitate new scenarios. Some may even be disruptive similar to how MP3 players changed the music industry or electronic readers changed the publishing model. To be competitive, organizations will require new technology with clear implementation strategies, iterative test-and-learn environments and data science talent.
Companies who compete on analytics and delivering data-driven services tend to experiment with many small models or iterate quickly on big data. This enables rapid data exploration to identify unknown relationships and trends to create new products and services.
Data overload is going to be a huge challenge for businesses and a headache for decision makers. Big Data = new data sources + data variety & velocity + fine grain control + data movement. Public and private sector corporations are going to drown in data — from sales, transactions, pricing, supply chains, discounts, product, customer process, projects, RFID smart tags, tracking of shipments, as well as e-mail, Web traffic and social media. Without a smart use case strategy, a lot of this data will be wasted.
Notes and References
1. What is a Use Case? A business use case describes what the process does. It is meant to describe in technology-free jargon the business process that is used by its business actors (people or systems external to the process) to achieve their goals . The business use case will describe a process that provides value to the business actor.
2. Best practice firms (and even political campaigns) can’t operate on anecdotes, opinions and gut instinct. They have to strike a measured balance between opinion vs. scorecards vs. KPI metrics. Rather than data-driven, they need to be data-informed. That’s a big shift.
By Michael Scherer
updated 11:45 AM EST, Thu November 8, 2012
|
4. Less than one percent of the world’s data is being analyzed. The IDC study, “Big Data, Bigger Digital Shadows, and Biggest Growth in the Far East,” finds that little “big data potential” is being realized globally. As the digital universe reaches 40 zettabytes by 2020, it will have increased 50-fold since 2010. IDC recently raised its forecast by 5 ZB. –>READ THE FULL ARTICLE
5) See also: A Very Short History of Data Science ;
6) See also A Very Short History of Big Data
7) Mashable lists five of the more unusual of these projects. They include:
- Homicide Watch D.C. (a precursor to the Minority Report?)
- Falling Fruit (you can find hidden outdoor edibles in urban settings, hopefully road kill isn’t included)
- Topography of Tweets (a Twitter visualization map to show you where most people are tweeting from in certain cities, because, I dunno why) .
8) Use Case Enablers – Data Sciences -> Mathematical Techniques -> Computing Tools -> Vertical/Horizontal Analytics
No comments:
Post a Comment